Macy's 2013 Annual Report Download - page 66
Download and view the complete annual report
Please find page 66 of the 2013 Macy's annual report below. You can navigate through the pages in the report by either clicking on the pages listed below, or by using the keyword search tool below to find specific information within the annual report.-
 1
1 -
2
-
3
-
4
-
5
-
6
-
7
-
8
-
9
-
10
-
11
-
12
-
13
-
14
-
15
-
16
-
17
-
18
-
19
-
20
-
21
-
22
-
23
-
24
-
25
-
26
-
27
-
28
-
29
-
30
-
31
-
32
-
33
-
34
-
35
-
36
-
37
-
38
-
39
-
40
-
41
-
42
-
43
-
44
-
45
-
46
-
47
-
48
-
49
-
50
-
51
-
52
-
53
-
54
-
55
-
 56
56 -
 57
57 -
 58
58 -
 59
59 -
 60
60 -
 61
61 -
 62
62 -
 63
63 -
 64
64 -
 65
65 -
 66
66 -
 67
67 -
 68
68 -
 69
69 -
 70
70 -
 71
71 -
 72
72 -
 73
73 -
 74
74 -
 75
75 -
 76
76 -
77
-
78
-
79
-
80
-
81
-
82
-
83
-
84
-
85
-
86
-
87
-
88
-
89
-
90
-
91
-
92
-
93
-
94
-
95
-
96
-
97
-
98
-
99
-
100
-
101
-
102
-
103
-
104
-
105
-
106
-
107
-
108
-
109
-
110
-
111
-
112
-
113
-
114
-
115
-
116
-
117
-
118
-
119
-
120
-
121
-
122
-
123
-
124
-
125
-
126
-
127
-
128
-
129
-
130
-
131
-
132
-
133
-
134
-
135
-
136
-
137
-
138
-
139
-
140
-
141
-
142
-
143
-
144
-
145
-
146
-
147
-
148
-
149
-
150
-
151
-
152
-
153
-
154
-
155
-
156
-
157
-
158
-
159
-
160
-
161
-
162
-
163
-
164
-
165
-
166
-
167
-
168
-
169
-
170
-
171
-
172
-
173
-
174
-
175
-
176
-
177
-
178
-
179
-
180
-
181
-
182
-
183
-
184
-
185
-
186
-
187
-
188
-
189
-
190
-
191
-
192
-
193
-
194
-
195
-
196
-
197
-
198
-
199
-
200
-
201
-
202
-
203
-
204
-
205
-
206
-
207
-
208
-
209
-
210
-
211
-
212
-
213
-
214
-
215
-
216
-
217
-
218
-
219
-
220
-
221
-
222
-
223
-
224
-
225
-
226
-
227
-
228
-
229
-
230
-
231
-
232
-
233
-
234
-
235
-
236
-
237
-
238
-
239
-
240
-
241
-
242
-
243
-
244
-
245
-
246
-
247
-
248
-
249
-
250
-
251
-
252
-
253
-
254
-
255
-
256
-
257
-
258
-
259
-
260
-
261
-
262
-
263
-
264
-
265
-
266
-
267
-
268
-
269
-
270
-
271
-
272
-
273
-
274
-
275
-
276
-
277
-
278
-
279
-
280
-
281
-
282
-
283
-
284
-
285
-
286
-
287
-
288
 |
 |
Table of Contents
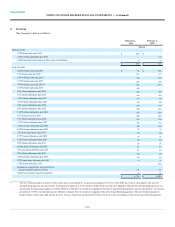
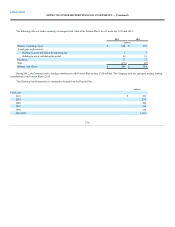
The following table shows the detail of debt repayments:
7.625% Senior debentures due 2013 $ 109
$ —
$ —
5.35% Senior notes due 2012 —
616
—
5.90% Senior notes due 2016 —
400
—
5.875% Senior notes due 2013 —
298
—
7.875% Senior notes due 2015 —
205
—
8.0% Senior debentures due 2012 —
173
—
7.45% Senior debentures due 2016 —
64
—
7.5% Senior debentures due 2015 —
31
—
6.625% Senior notes due 2011 —
—
330
7.45% Senior debentures due 2011 —
—
109
9.5% amortizing debentures due 2021 4
4
4
9.75% amortizing debentures due 2021 2
2
2
Capital leases and other obligations 9
10
9
$124
$1,803
$454
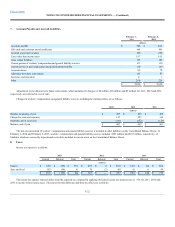
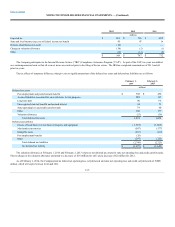
The following summarizes certain components of the Company’s debt:
Bank Credit Agreement
The Company entered into a new credit agreement with certain financial institutions on May 10, 2013 providing for revolving credit borrowings and
letters of credit in an aggregate amount not to exceed $1,500 million (which may be increased to $1,750 million at the option of the Company, subject to the
willingness of existing or new lenders to provide commitments for such additional financing) outstanding at any particular time. The agreement is set to expire
May 10, 2018 and replaced the prior agreement which was set to expire June 20, 2015.
As of February 1, 2014, and February 2, 2013, there were no revolving credit loans outstanding under these credit agreements, and there were no
borrowings under these agreements throughout all of 2013 and 2012. However, there were less than $1 million of standby letters of credit outstanding at
February 1, 2014 and February 2, 2013. Revolving loans under the credit agreement bear interest based on various published rates.
The Company's credit agreement, which is an obligation of a 100%-owned subsidiary of Macy’s, Inc. (“Parent”), is not secured. However, Parent has
fully and unconditionally guaranteed this obligation, subject to specified limitations.The Company’s interest coverage ratio for 2013 was 9.40 and its leverage
ratio at February 1, 2014 was 1.85, in each case as calculated in accordance with the credit agreement. The credit agreement requires the Company to maintain
a specified interest coverage ratio for the latest four quarters of no less than 3.25 and a specified leverage ratio as of and for the latest four quarters of no more
than 3.75. The interest coverage ratio is defined as EBITDA (earnings before interest, taxes, depreciation and amortization) over net interest expense and the
leverage ratio is defined as debt over EBITDA. For purposes of these calculations EBITDA is calculated as net income plus interest expense, taxes,
depreciation, amortization, non-cash impairment of goodwill, intangibles and real estate, non-recurring cash charges not to exceed in the aggregate $400 million
and extraordinary losses less interest income and non-recurring or extraordinary gains. Debt is adjusted to exclude the premium on acquired debt and net
interest is adjusted to exclude the amortization of premium on acquired debt and premium on early retirement of debt.
F-20