Macy's 2013 Annual Report Download - page 3
Download and view the complete annual report
Please find page 3 of the 2013 Macy's annual report below. You can navigate through the pages in the report by either clicking on the pages listed below, or by using the keyword search tool below to find specific information within the annual report.-
 1
1 -
 2
2 -
 3
3 -
 4
4 -
 5
5 -
 6
6 -
 7
7 -
 8
8 -
 9
9 -
 10
10 -
 11
11 -
 12
12 -
 13
13 -
 14
14 -
15
-
16
-
17
-
18
-
19
-
20
-
21
-
22
-
23
-
24
-
25
-
26
-
27
-
28
-
29
-
30
-
31
-
32
-
33
-
34
-
35
-
36
-
37
-
38
-
39
-
40
-
41
-
42
-
43
-
44
-
45
-
46
-
47
-
48
-
49
-
50
-
51
-
52
-
53
-
54
-
55
-
56
-
57
-
58
-
59
-
60
-
61
-
62
-
63
-
64
-
65
-
66
-
67
-
68
-
69
-
70
-
71
-
72
-
73
-
74
-
75
-
76
-
77
-
78
-
79
-
80
-
81
-
82
-
83
-
84
-
85
-
86
-
87
-
88
-
89
-
90
-
91
-
92
-
93
-
94
-
95
-
96
-
97
-
98
-
99
-
100
-
101
-
102
-
103
-
104
-
105
-
106
-
107
-
108
-
109
-
110
-
111
-
112
-
113
-
114
-
115
-
116
-
117
-
118
-
119
-
120
-
121
-
122
-
123
-
124
-
125
-
126
-
127
-
128
-
129
-
130
-
131
-
132
-
133
-
134
-
135
-
136
-
137
-
138
-
139
-
140
-
141
-
142
-
143
-
144
-
145
-
146
-
147
-
148
-
149
-
150
-
151
-
152
-
153
-
154
-
155
-
156
-
157
-
158
-
159
-
160
-
161
-
162
-
163
-
164
-
165
-
166
-
167
-
168
-
169
-
170
-
171
-
172
-
173
-
174
-
175
-
176
-
177
-
178
-
179
-
180
-
181
-
182
-
183
-
184
-
185
-
186
-
187
-
188
-
189
-
190
-
191
-
192
-
193
-
194
-
195
-
196
-
197
-
198
-
199
-
200
-
201
-
202
-
203
-
204
-
205
-
206
-
207
-
208
-
209
-
210
-
211
-
212
-
213
-
214
-
215
-
216
-
217
-
218
-
219
-
220
-
221
-
222
-
223
-
224
-
225
-
226
-
227
-
228
-
229
-
230
-
231
-
232
-
233
-
234
-
235
-
236
-
237
-
238
-
239
-
240
-
241
-
242
-
243
-
244
-
245
-
246
-
247
-
248
-
249
-
250
-
251
-
252
-
253
-
254
-
255
-
256
-
257
-
258
-
259
-
260
-
261
-
262
-
263
-
264
-
265
-
266
-
267
-
268
-
269
-
270
-
271
-
272
-
273
-
274
-
275
-
276
-
277
-
278
-
279
-
280
-
281
-
282
-
283
-
284
-
285
-
286
-
287
-
288
 |
 |
Our company’s momentum continued to build in 2013 as we
drove improvement in Macy’s, Inc.’s financial results, as well as
in the execution of our key strategies. We again outperformed
major competitors across the retail spectrum.
We are most proud of the consistency of our strong
performance, which has led to consecutive year-over-year
increases in sales and earnings, as well as healthy cash flow,
since we unified our organizational structure and began
implementing My Macy’s localization on a nationwide basis
in 2009. In fact, 2013 was our fifth consecutive year of double-
digit growth in earnings per share.
Here are highlights from our fiscal 2013 financial results, which are
presented and discussed in greater detail in the company’s 2013
Form 10-K (including important information on pages 16 to 19
regarding our non-GAAP financial measures):
• Growth of 2.8 percent in comparable sales combined with
comparable sales of departments licensed to third parties.
Comparable sales without comparable sales of departments
licensed to third parties grew by 1.9 percent.
• Adjusted EBITDA as a percent to sales rose to 13.6 percent,
compared with 13.4 percent in 2012. This represents
progress toward the company’s goal of adjusted EBITDA
as a percent to sales of 14 percent. Adjusted EBITDA as a
percent to sales has risen steadily from 11.3 percent in 2009.
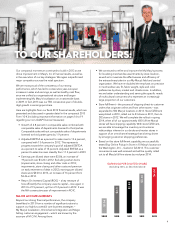
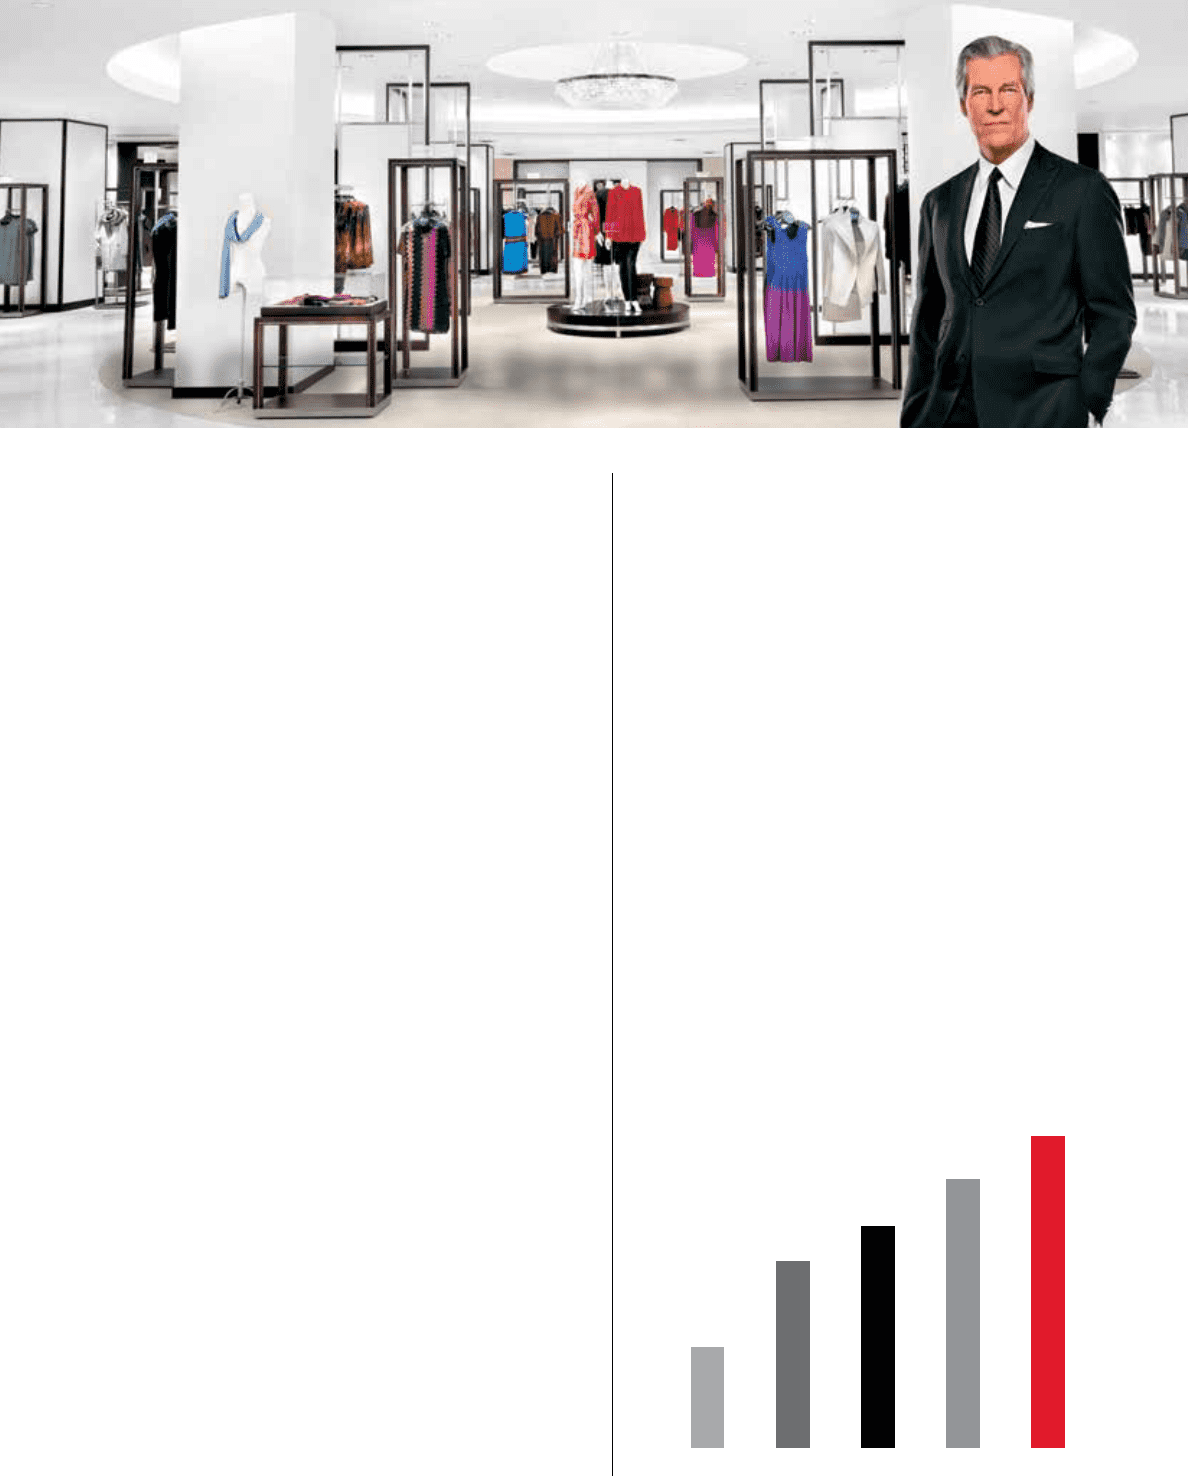
• Earnings per diluted share were $3.86, an increase of
19 percent over $3.24 in 2012. Excluding certain items
(impairments, store closing and other costs in 2013;
impairments, store closing and other costs and premium
on early retirement of debt in 2012), earnings per diluted
share were $4.00 in 2013, an increase of 16 percent from
$3.46 in 2012.
• Return On Invested Capital (ROIC) – a key measure of
how efficiently the company uses its capital – rose again in
2013 to 21.5 percent, up from 21.2 percent in 2012. It was
the fifth consecutive year of improvement in ROIC.
MAJOR ACCOMPLISHMENTS
Beyond our strong financial performance, the company
benefitted in 2013 from a number of significant actions to
support our highly successful core business strategies –
My Macy’s localization, Omnichannel integration and Magic
Selling customer engagement – which are known by the
acronym of M.O.M. Among them:
• We continued to refine and improve the My Macy’s process
for localizing merchandise assortments by store location,
as well as to maximize the effectiveness and efficiency of
the extraordinary talent in our My Macy’s field and central
organization. We have re-doubled the emphasis on precision
in merchandise size, fit, fabric weight, style and color
preferences by store, market and climate zone. In addition,
we are better understanding and serving the specific needs
of multicultural consumers who represent an increasingly
large proportion of our customers.
• Store fulfillment – the process of shipping direct-to-customer
orders that originate online and from other stores – was
expanded to 500 Macy’s locations in 2013. Store fulfillment
was piloted in 2010, rolled out to 23 stores in 2011, then to
292 stores in 2012. We will complete the rollout in spring
2014, when all of our approximately 650 full-line Macy’s
stores will have shipping capability. With store fulfillment,
we are able to leverage the inventory and customer
relationships inherent in our bricks-and-mortar stores in
support of an omnichannel strategy that is being driven
by emerging customer shopping preferences.
• Based on this store fulfillment capability, we successfully
tested Buy Online Pickup In Store in 10 Macy’s locations in
the Washington, D.C., market in fall 2013. This customer
convenience was well-received and will be quickly rolled
out to all Macy’s full-line stores by mid-year 2014.
1
TO OUR SHAREHOLDERS:
$3.46
2012
$2.88
2011
$2.11
2010
$1.36
2009
$4.00
2013
EARNINGS PER DILUTED SHARE
(excluding items, as described above)