Macy's 2013 Annual Report Download - page 89
Download and view the complete annual report
Please find page 89 of the 2013 Macy's annual report below. You can navigate through the pages in the report by either clicking on the pages listed below, or by using the keyword search tool below to find specific information within the annual report.-
 1
1 -
2
-
3
-
4
-
5
-
6
-
7
-
8
-
9
-
10
-
11
-
12
-
13
-
14
-
15
-
16
-
17
-
18
-
19
-
20
-
21
-
22
-
23
-
24
-
25
-
26
-
27
-
28
-
29
-
30
-
31
-
32
-
33
-
34
-
35
-
36
-
37
-
38
-
39
-
40
-
41
-
42
-
43
-
44
-
45
-
46
-
47
-
48
-
49
-
50
-
51
-
52
-
53
-
54
-
55
-
56
-
57
-
58
-
59
-
60
-
61
-
62
-
63
-
64
-
65
-
66
-
67
-
68
-
69
-
70
-
71
-
72
-
73
-
74
-
75
-
76
-
77
-
78
-
 79
79 -
 80
80 -
 81
81 -
 82
82 -
 83
83 -
 84
84 -
 85
85 -
 86
86 -
 87
87 -
 88
88 -
 89
89 -
 90
90 -
 91
91 -
 92
92 -
 93
93 -
 94
94 -
 95
95 -
 96
96 -
 97
97 -
 98
98 -
 99
99 -
100
-
101
-
102
-
103
-
104
-
105
-
106
-
107
-
108
-
109
-
110
-
111
-
112
-
113
-
114
-
115
-
116
-
117
-
118
-
119
-
120
-
121
-
122
-
123
-
124
-
125
-
126
-
127
-
128
-
129
-
130
-
131
-
132
-
133
-
134
-
135
-
136
-
137
-
138
-
139
-
140
-
141
-
142
-
143
-
144
-
145
-
146
-
147
-
148
-
149
-
150
-
151
-
152
-
153
-
154
-
155
-
156
-
157
-
158
-
159
-
160
-
161
-
162
-
163
-
164
-
165
-
166
-
167
-
168
-
169
-
170
-
171
-
172
-
173
-
174
-
175
-
176
-
177
-
178
-
179
-
180
-
181
-
182
-
183
-
184
-
185
-
186
-
187
-
188
-
189
-
190
-
191
-
192
-
193
-
194
-
195
-
196
-
197
-
198
-
199
-
200
-
201
-
202
-
203
-
204
-
205
-
206
-
207
-
208
-
209
-
210
-
211
-
212
-
213
-
214
-
215
-
216
-
217
-
218
-
219
-
220
-
221
-
222
-
223
-
224
-
225
-
226
-
227
-
228
-
229
-
230
-
231
-
232
-
233
-
234
-
235
-
236
-
237
-
238
-
239
-
240
-
241
-
242
-
243
-
244
-
245
-
246
-
247
-
248
-
249
-
250
-
251
-
252
-
253
-
254
-
255
-
256
-
257
-
258
-
259
-
260
-
261
-
262
-
263
-
264
-
265
-
266
-
267
-
268
-
269
-
270
-
271
-
272
-
273
-
274
-
275
-
276
-
277
-
278
-
279
-
280
-
281
-
282
-
283
-
284
-
285
-
286
-
287
-
288
 |
 |

Table of Contents
The net actuarial gains and losses and prior service costs and credits related to post employment and postretirement benefit plans are reclassified out of
accumulated other comprehensive loss and included in the computation of net periodic benefit costs and included in SG&A expenses in the Consolidated
Statements of Income. See Note 9, "Retirement Plans," and Note 10, "Postretirement Health Care and Life Insurance Benefits," for further information. On
February 25, 2011, the Company sold its investment in The Knot, Inc. and unrecognized gains in accumulated other comprehensive income were reclassified
and recognized into SG&A expenses in the Consolidated Statements of Income.
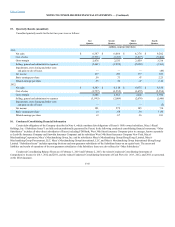
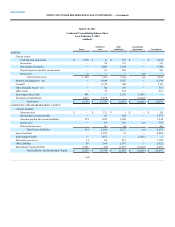
The following table shows the Company’s financial assets that are required to be measured at fair value on a recurring basis, by level within the
hierarchy as defined by applicable accounting standards:
Marketable
equity and
debt securities $75
$ —
$75
$ —
$68
$ —
$68
$ —
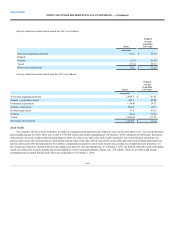
Other financial instruments not measured at fair value on a recurring basis include cash and cash equivalents, receivables, short-term debt,
merchandise accounts payable, accounts payable and accrued liabilities and long-term debt. With the exception of long-term debt, the carrying amount
approximates fair value because of the short maturity of these instruments. The fair values of long-term debt, excluding capitalized leases, are generally
estimated based on quoted market prices for identical or similar instruments, and are classified as Level 2 measurements within the hierarchy as defined by
applicable accounting standards.
The following table shows the estimated fair value of the Company’s long-term debt:
Long-term debt $6,522
$6,698
$7,171
$6,583
$6,774
$7,351
The following table shows certain of the Company’s non-financial assets that were measured at fair value on a nonrecurring basis during 2013 and
2012:
Long-lived assets
held and used $13
$ —
$ —
$13
$ 1
$ —
$ —
$ 1
F-43