Macy's 2013 Annual Report Download - page 75
Download and view the complete annual report
Please find page 75 of the 2013 Macy's annual report below. You can navigate through the pages in the report by either clicking on the pages listed below, or by using the keyword search tool below to find specific information within the annual report.-
 1
1 -
2
-
3
-
4
-
5
-
6
-
7
-
8
-
9
-
10
-
11
-
12
-
13
-
14
-
15
-
16
-
17
-
18
-
19
-
20
-
21
-
22
-
23
-
24
-
25
-
26
-
27
-
28
-
29
-
30
-
31
-
32
-
33
-
34
-
35
-
36
-
37
-
38
-
39
-
40
-
41
-
42
-
43
-
44
-
45
-
46
-
47
-
48
-
49
-
50
-
51
-
52
-
53
-
54
-
55
-
56
-
57
-
58
-
59
-
60
-
61
-
62
-
63
-
64
-
 65
65 -
 66
66 -
 67
67 -
 68
68 -
 69
69 -
 70
70 -
 71
71 -
 72
72 -
 73
73 -
 74
74 -
 75
75 -
 76
76 -
 77
77 -
 78
78 -
 79
79 -
 80
80 -
 81
81 -
 82
82 -
 83
83 -
 84
84 -
 85
85 -
86
-
87
-
88
-
89
-
90
-
91
-
92
-
93
-
94
-
95
-
96
-
97
-
98
-
99
-
100
-
101
-
102
-
103
-
104
-
105
-
106
-
107
-
108
-
109
-
110
-
111
-
112
-
113
-
114
-
115
-
116
-
117
-
118
-
119
-
120
-
121
-
122
-
123
-
124
-
125
-
126
-
127
-
128
-
129
-
130
-
131
-
132
-
133
-
134
-
135
-
136
-
137
-
138
-
139
-
140
-
141
-
142
-
143
-
144
-
145
-
146
-
147
-
148
-
149
-
150
-
151
-
152
-
153
-
154
-
155
-
156
-
157
-
158
-
159
-
160
-
161
-
162
-
163
-
164
-
165
-
166
-
167
-
168
-
169
-
170
-
171
-
172
-
173
-
174
-
175
-
176
-
177
-
178
-
179
-
180
-
181
-
182
-
183
-
184
-
185
-
186
-
187
-
188
-
189
-
190
-
191
-
192
-
193
-
194
-
195
-
196
-
197
-
198
-
199
-
200
-
201
-
202
-
203
-
204
-
205
-
206
-
207
-
208
-
209
-
210
-
211
-
212
-
213
-
214
-
215
-
216
-
217
-
218
-
219
-
220
-
221
-
222
-
223
-
224
-
225
-
226
-
227
-
228
-
229
-
230
-
231
-
232
-
233
-
234
-
235
-
236
-
237
-
238
-
239
-
240
-
241
-
242
-
243
-
244
-
245
-
246
-
247
-
248
-
249
-
250
-
251
-
252
-
253
-
254
-
255
-
256
-
257
-
258
-
259
-
260
-
261
-
262
-
263
-
264
-
265
-
266
-
267
-
268
-
269
-
270
-
271
-
272
-
273
-
274
-
275
-
276
-
277
-
278
-
279
-
280
-
281
-
282
-
283
-
284
-
285
-
286
-
287
-
288
 |
 |

Table of Contents
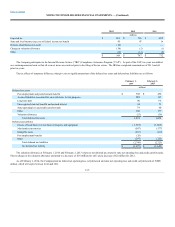
The fair values of the Pension Plan assets as of February 2, 2013, excluding interest and dividend receivables and pending investment purchases and
sales, by asset category are as follows:
Cash and cash equivalents $204
$ —
$204
$ —
Equity securities:
U.S. 832
290
542
—
International 818
—
818
—
Fixed income securities:
U. S. Treasury bonds 136
—
136
—
Other Government bonds 34
—
34
—
Agency backed bonds 6
—
6
—
Corporate bonds 338
—
338
—
Mortgage-backed securities and forwards 102
—
102
—
Asset-backed securities 24
—
24
—
Pooled funds 303
—
303
—
Other types of investments:
Real estate 280
—
—
280
Hedge funds 154
—
—
154
Private equity 160
—
—
160
Total $ 3,391
$ 290
$2,507
$594
Corporate bonds consist primarily of investment grade bonds of U.S. issuers from diverse industries.
The fair value of the real estate, hedge funds and private equity investments represents the reported net asset value of shares or underlying assets of the
investment. Private equity and real estate investments are valued using fair values per the most recent financial reports provided by the investment sponsor,
adjusted as appropriate for any lag between the date of the financial reports and the Company’s reporting date. The real estate investments are diversified
across property types and geographical areas primarily in the United States of America. Private equity investments generally consist of limited partnerships in
the United States of America, Europe and Asia. The hedge fund investments are through a fund of funds approach.
Due to the nature of the underlying assets of the real estate, hedge funds and private equity investments, changes in market conditions and the economic
environment may significantly impact the net asset value of these investments and, consequently, the fair value of the Pension Plan’s investments. These
investments are redeemable at net asset value to the extent provided in the documentation governing the investments. However, these redemption rights may be
restricted in accordance with the governing documents. Redemption of these investments is subject to restrictions including lock-up periods where no
redemptions are allowed, restrictions on redemption frequency and advance notice periods for redemptions. As of February 1, 2014 and February 2, 2013,
certain of these investments are generally subject to lock-up periods, ranging from three to fifteen years, certain of these investments are subject to restrictions
on redemption frequency, ranging from daily to twice per year, and certain of these investments are subject to advance notice requirements, ranging from sixty-
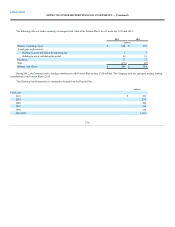
day notification to ninety-day notification. As of February 1, 2014 and February 2, 2013, the Pension Plan had unfunded commitments related to certain of
these investments totaling $150 million and $144 million, respectively.
F-29