Macy's 2013 Annual Report Download - page 85
Download and view the complete annual report
Please find page 85 of the 2013 Macy's annual report below. You can navigate through the pages in the report by either clicking on the pages listed below, or by using the keyword search tool below to find specific information within the annual report.-
 1
1 -
2
-
3
-
4
-
5
-
6
-
7
-
8
-
9
-
10
-
11
-
12
-
13
-
14
-
15
-
16
-
17
-
18
-
19
-
20
-
21
-
22
-
23
-
24
-
25
-
26
-
27
-
28
-
29
-
30
-
31
-
32
-
33
-
34
-
35
-
36
-
37
-
38
-
39
-
40
-
41
-
42
-
43
-
44
-
45
-
46
-
47
-
48
-
49
-
50
-
51
-
52
-
53
-
54
-
55
-
56
-
57
-
58
-
59
-
60
-
61
-
62
-
63
-
64
-
65
-
66
-
67
-
68
-
69
-
70
-
71
-
72
-
73
-
74
-
 75
75 -
 76
76 -
 77
77 -
 78
78 -
 79
79 -
 80
80 -
 81
81 -
 82
82 -
 83
83 -
 84
84 -
 85
85 -
 86
86 -
 87
87 -
 88
88 -
 89
89 -
 90
90 -
 91
91 -
 92
92 -
 93
93 -
 94
94 -
 95
95 -
96
-
97
-
98
-
99
-
100
-
101
-
102
-
103
-
104
-
105
-
106
-
107
-
108
-
109
-
110
-
111
-
112
-
113
-
114
-
115
-
116
-
117
-
118
-
119
-
120
-
121
-
122
-
123
-
124
-
125
-
126
-
127
-
128
-
129
-
130
-
131
-
132
-
133
-
134
-
135
-
136
-
137
-
138
-
139
-
140
-
141
-
142
-
143
-
144
-
145
-
146
-
147
-
148
-
149
-
150
-
151
-
152
-
153
-
154
-
155
-
156
-
157
-
158
-
159
-
160
-
161
-
162
-
163
-
164
-
165
-
166
-
167
-
168
-
169
-
170
-
171
-
172
-
173
-
174
-
175
-
176
-
177
-
178
-
179
-
180
-
181
-
182
-
183
-
184
-
185
-
186
-
187
-
188
-
189
-
190
-
191
-
192
-
193
-
194
-
195
-
196
-
197
-
198
-
199
-
200
-
201
-
202
-
203
-
204
-
205
-
206
-
207
-
208
-
209
-
210
-
211
-
212
-
213
-
214
-
215
-
216
-
217
-
218
-
219
-
220
-
221
-
222
-
223
-
224
-
225
-
226
-
227
-
228
-
229
-
230
-
231
-
232
-
233
-
234
-
235
-
236
-
237
-
238
-
239
-
240
-
241
-
242
-
243
-
244
-
245
-
246
-
247
-
248
-
249
-
250
-
251
-
252
-
253
-
254
-
255
-
256
-
257
-
258
-
259
-
260
-
261
-
262
-
263
-
264
-
265
-
266
-
267
-
268
-
269
-
270
-
271
-
272
-
273
-
274
-
275
-
276
-
277
-
278
-
279
-
280
-
281
-
282
-
283
-
284
-
285
-
286
-
287
-
288
 |
 |
Table of Contents
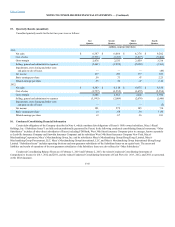
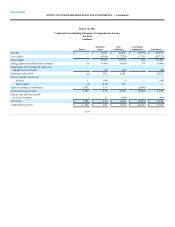
Activity related to stock options for 2013 is as follows:
Outstanding, beginning of period 29,792.9
$ 29.07
Granted 3,621.5
$ 41.67
Canceled or forfeited (485.0)
$33.47
Exercised (9,615.8)
$26.44
Outstanding, end of period 23,313.6
$32.02
Exercisable, end of period 14,365.6
$30.20
3.9
$330
Options expected to vest 7,874.3
$ 34.95
8.1
$144
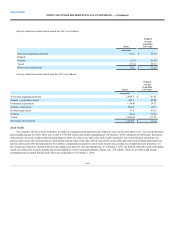
Additional information relating to stock options is as follows:
Intrinsic value of options exercised $207
$132
$ 64
Grant date fair value of stock options that vested during the year 31
30
50
Cash received from stock options exercised 254
164
141
Excess tax benefits realized from exercised stock options 51
36
20
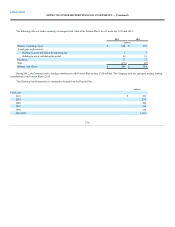
Restricted Stock and Restricted Stock Units
The weighted average grant date fair value of restricted stock and restricted stock units granted during 2013, 2012 and 2011 are as follows:
Restricted stock $ —
$ —
$23.43
Restricted stock units $42.54
$39.52
$23.69
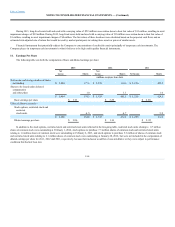
The fair value of the Target Shares and restricted stock awards are based on the fair value of the underlying shares on the date of grant. The fair value of
the portion of the Target Shares granted in 2012 and 2013 that relate to a relative TSR performance objective was determined using a Monte Carlo simulation
analysis to estimate the total shareholder return ranking of the Company among a ten-company executive compensation peer group over the remaining
performance periods. The expected volatility of the Company’s common stock at the date of grant was estimated based on a historical average volatility rate for
the approximate three-year performance period. The dividend yield assumption was based on historical and anticipated dividend payouts. The risk-free
interest rate assumption was based on observed interest rates consistent with the approximate three-year performance measurement period.
Compensation expense is recorded for all restricted stock and restricted stock unit awards based on the amortization of the fair market value at the date
of grant over the period the restrictions lapse or over the performance period of the performance-based restricted stock units.
F-39