Macy's 2013 Annual Report Download - page 88
Download and view the complete annual report
Please find page 88 of the 2013 Macy's annual report below. You can navigate through the pages in the report by either clicking on the pages listed below, or by using the keyword search tool below to find specific information within the annual report.-
 1
1 -
2
-
3
-
4
-
5
-
6
-
7
-
8
-
9
-
10
-
11
-
12
-
13
-
14
-
15
-
16
-
17
-
18
-
19
-
20
-
21
-
22
-
23
-
24
-
25
-
26
-
27
-
28
-
29
-
30
-
31
-
32
-
33
-
34
-
35
-
36
-
37
-
38
-
39
-
40
-
41
-
42
-
43
-
44
-
45
-
46
-
47
-
48
-
49
-
50
-
51
-
52
-
53
-
54
-
55
-
56
-
57
-
58
-
59
-
60
-
61
-
62
-
63
-
64
-
65
-
66
-
67
-
68
-
69
-
70
-
71
-
72
-
73
-
74
-
75
-
76
-
77
-
 78
78 -
 79
79 -
 80
80 -
 81
81 -
 82
82 -
 83
83 -
 84
84 -
 85
85 -
 86
86 -
 87
87 -
 88
88 -
 89
89 -
 90
90 -
 91
91 -
 92
92 -
 93
93 -
 94
94 -
 95
95 -
 96
96 -
 97
97 -
 98
98 -
99
-
100
-
101
-
102
-
103
-
104
-
105
-
106
-
107
-
108
-
109
-
110
-
111
-
112
-
113
-
114
-
115
-
116
-
117
-
118
-
119
-
120
-
121
-
122
-
123
-
124
-
125
-
126
-
127
-
128
-
129
-
130
-
131
-
132
-
133
-
134
-
135
-
136
-
137
-
138
-
139
-
140
-
141
-
142
-
143
-
144
-
145
-
146
-
147
-
148
-
149
-
150
-
151
-
152
-
153
-
154
-
155
-
156
-
157
-
158
-
159
-
160
-
161
-
162
-
163
-
164
-
165
-
166
-
167
-
168
-
169
-
170
-
171
-
172
-
173
-
174
-
175
-
176
-
177
-
178
-
179
-
180
-
181
-
182
-
183
-
184
-
185
-
186
-
187
-
188
-
189
-
190
-
191
-
192
-
193
-
194
-
195
-
196
-
197
-
198
-
199
-
200
-
201
-
202
-
203
-
204
-
205
-
206
-
207
-
208
-
209
-
210
-
211
-
212
-
213
-
214
-
215
-
216
-
217
-
218
-
219
-
220
-
221
-
222
-
223
-
224
-
225
-
226
-
227
-
228
-
229
-
230
-
231
-
232
-
233
-
234
-
235
-
236
-
237
-
238
-
239
-
240
-
241
-
242
-
243
-
244
-
245
-
246
-
247
-
248
-
249
-
250
-
251
-
252
-
253
-
254
-
255
-
256
-
257
-
258
-
259
-
260
-
261
-
262
-
263
-
264
-
265
-
266
-
267
-
268
-
269
-
270
-
271
-
272
-
273
-
274
-
275
-
276
-
277
-
278
-
279
-
280
-
281
-
282
-
283
-
284
-
285
-
286
-
287
-
288
 |
 |

Table of Contents
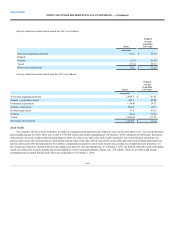
Changes in the Company’s Common Stock issued and outstanding, including shares held by the Company’s treasury, are as follows:
Balance at January 29, 2011 495,038.5
(1,249.0)
(70,448.2)
(71,697.2)
423,341.3
Stock issued under stock plans
(87.2)
7,274.1
7,186.9
7,186.9
Stock repurchases
Repurchase program
(16,356.5)
(16,356.5)
(16,356.5)
Other
(80.1)
(80.1)
(80.1)
Deferred compensation plan distributions
89.4
89.4
89.4
Retirement of common stock (7,700.0)
7,700.0
7,700.0
—
Balance at January 28, 2012 487,338.5
(1,246.8)
(71,910.7)
(73,157.5)
414,181.0
Stock issued under stock plans
(89.2)
10,325.1
10,235.9
10,235.9
Stock repurchases
Repurchase program
(35,572.9)
(35,572.9)
(35,572.9)
Other
(1,269.4)
(1,269.4)
(1,269.4)
Deferred compensation plan distributions
126.5
126.5
126.5
Retirement of common stock (42,732.7)
42,732.7
42,732.7
—
Balance at February 2, 2013 444,605.8
(1,209.5)
(55,695.2)
(56,904.7)
387,701.1
Stock issued under stock plans
(85.2)
10,891.1
10,805.9
10,805.9
Stock repurchases
Repurchase program
(33,625.3)
(33,625.3)
(33,625.3)
Other
(12.2)
(12.2)
(12.2)
Deferred compensation plan distributions
65.5
65.5
65.5
Retirement of common stock (34,000.0)
34,000.0
34,000.0
—
Balance at February 1, 2014 410,605.8
(1,229.2)
(44,441.6)
(45,670.8)
364,935.0
Accumulated Other Comprehensive Loss
The following tables shows for 2013, 2012 and 2011 the beginning and ending balance of, and the activity associated with, accumulated other
comprehensive loss, net of income tax effects:
Balance at January 29, 2011 $(10)
$740
$730
Other comprehensive loss 10
321
331
Balance at January 28, 2012 —
1,061
1,061
Other comprehensive income —
(130)
(130)
Balance at February 2, 2013 —
931
931
Other comprehensive income —
(266)
(266)
Balance at February 1, 2014 $ —
$665
$665
F-42