Macy's 2013 Annual Report Download - page 54
Download and view the complete annual report
Please find page 54 of the 2013 Macy's annual report below. You can navigate through the pages in the report by either clicking on the pages listed below, or by using the keyword search tool below to find specific information within the annual report.-
 1
1 -
2
-
3
-
4
-
5
-
6
-
7
-
8
-
9
-
10
-
11
-
12
-
13
-
14
-
15
-
16
-
17
-
18
-
19
-
20
-
21
-
22
-
23
-
24
-
25
-
26
-
27
-
28
-
29
-
30
-
31
-
32
-
33
-
34
-
35
-
36
-
37
-
38
-
39
-
40
-
41
-
42
-
43
-
 44
44 -
 45
45 -
 46
46 -
 47
47 -
 48
48 -
 49
49 -
 50
50 -
 51
51 -
 52
52 -
 53
53 -
 54
54 -
 55
55 -
 56
56 -
 57
57 -
 58
58 -
 59
59 -
 60
60 -
 61
61 -
 62
62 -
 63
63 -
 64
64 -
65
-
66
-
67
-
68
-
69
-
70
-
71
-
72
-
73
-
74
-
75
-
76
-
77
-
78
-
79
-
80
-
81
-
82
-
83
-
84
-
85
-
86
-
87
-
88
-
89
-
90
-
91
-
92
-
93
-
94
-
95
-
96
-
97
-
98
-
99
-
100
-
101
-
102
-
103
-
104
-
105
-
106
-
107
-
108
-
109
-
110
-
111
-
112
-
113
-
114
-
115
-
116
-
117
-
118
-
119
-
120
-
121
-
122
-
123
-
124
-
125
-
126
-
127
-
128
-
129
-
130
-
131
-
132
-
133
-
134
-
135
-
136
-
137
-
138
-
139
-
140
-
141
-
142
-
143
-
144
-
145
-
146
-
147
-
148
-
149
-
150
-
151
-
152
-
153
-
154
-
155
-
156
-
157
-
158
-
159
-
160
-
161
-
162
-
163
-
164
-
165
-
166
-
167
-
168
-
169
-
170
-
171
-
172
-
173
-
174
-
175
-
176
-
177
-
178
-
179
-
180
-
181
-
182
-
183
-
184
-
185
-
186
-
187
-
188
-
189
-
190
-
191
-
192
-
193
-
194
-
195
-
196
-
197
-
198
-
199
-
200
-
201
-
202
-
203
-
204
-
205
-
206
-
207
-
208
-
209
-
210
-
211
-
212
-
213
-
214
-
215
-
216
-
217
-
218
-
219
-
220
-
221
-
222
-
223
-
224
-
225
-
226
-
227
-
228
-
229
-
230
-
231
-
232
-
233
-
234
-
235
-
236
-
237
-
238
-
239
-
240
-
241
-
242
-
243
-
244
-
245
-
246
-
247
-
248
-
249
-
250
-
251
-
252
-
253
-
254
-
255
-
256
-
257
-
258
-
259
-
260
-
261
-
262
-
263
-
264
-
265
-
266
-
267
-
268
-
269
-
270
-
271
-
272
-
273
-
274
-
275
-
276
-
277
-
278
-
279
-
280
-
281
-
282
-
283
-
284
-
285
-
286
-
287
-
288
 |
 |
Table of Contents
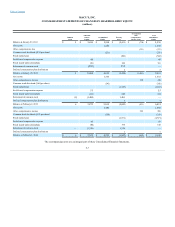
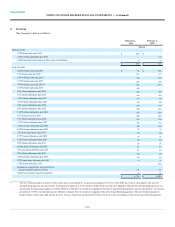
Cash flows from operating activities:
Net income $1,486
$1,335
$1,256
Adjustments to reconcile net income to net cash
provided by operating activities:
Impairments, store closing and other costs and gain
on sale of leases 88
5
(25)
Depreciation and amortization 1,020
1,049
1,085
Stock-based compensation expense 62
61
70
Amortization of financing costs and premium on acquired debt (8)
(16)
(15)
Changes in assets and liabilities:
(Increase) decrease in receivables (58)
7
(37)
Increase in merchandise inventories (249)
(191)
(359)
Increase in prepaid expenses and other current assets (2)
(7)
(17)
(Increase) decrease in other assets not separately identified (1)
23
6
Increase in merchandise accounts payable 101
23
143
Increase (decrease) in accounts payable and accrued
liabilities not separately identified 48
(33)
109
Increase (decrease) in current income taxes 7
(16)
188
Increase (decrease) in deferred income taxes (142)
14
153
Increase (decrease) in other liabilities not separately identified 197
(75)
(384)
Net cash provided by operating activities 2,549
2,179
2,173
Cash flows from investing activities:
Purchase of property and equipment (607)
(698)
(555)
Capitalized software (256)
(244)
(209)
Disposition of property and equipment 132
66
114
Proceeds from insurance claims —
—
6
Other, net (57)
95
(53)
Net cash used by investing activities (788)
(781)
(697)
Cash flows from financing activities:
Debt issued 400
1,000
800
Financing costs (9)
(11)
(20)
Debt repaid (124)
(1,803)
(454)
Dividends paid (359)
(324)
(148)
Increase (decrease) in outstanding checks 24
(88)
49
Acquisition of treasury stock (1,571)
(1,397)
(502)
Issuance of common stock 315
234
162
Net cash used by financing activities (1,324)
(2,389)
(113)
Net increase (decrease) in cash and cash equivalents 437
(991)
1,363
Cash and cash equivalents beginning of period 1,836
2,827
1,464
Cash and cash equivalents end of period $2,273
$1,836
$2,827
Supplemental cash flow information:
Interest paid $388
$585
$474
Interest received 2
2
4
Income taxes paid (net of refunds received) 835
738
401
The accompanying notes are an integral part of these Consolidated Financial Statements.
F-8