Macy's 2013 Annual Report Download - page 56
Download and view the complete annual report
Please find page 56 of the 2013 Macy's annual report below. You can navigate through the pages in the report by either clicking on the pages listed below, or by using the keyword search tool below to find specific information within the annual report.
Table of Contents
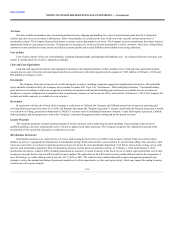
Net Sales
Net sales include merchandise sales, licensed department income, shipping and handling fees, sales of private brand goods directly to third party
retailers and sales of excess inventory to third parties. Sales of merchandise are recorded at the time of delivery to the customer and are reported net of
merchandise returns. The Company licenses third parties to operate certain departments in its stores. The Company receives commissions from these licensed
departments based on a percentage of net sales. Commissions are recognized as income at the time merchandise is sold to customers. Sales taxes collected from
customers are not considered revenue and are included in accounts payable and accrued liabilities until remitted to the taxing authorities.
Cost of Sales
Cost of sales consists of the cost of merchandise, including inbound freight, and shipping and handling costs. An estimated allowance for future sales
returns is recorded and cost of sales is adjusted accordingly.
Cash and Cash Equivalents
Cash and cash equivalents include cash and liquid investments with original maturities of three months or less. Cash and cash equivalents includes
amounts due in respect of credit card sales transactions that are settled early in the following period in the amount of $101 million at February 1, 2014 and
$99 million at February 2, 2013.
Investments
The Company from time to time invests in debt and equity securities, including companies engaged in complementary businesses. All marketable
equity and debt securities held by the Company are accounted for under ASC Topic 320, “Investments – Debt and Equity Securities.” Unrealized holding
gains and losses on trading securities are recognized in statement of operations and unrealized holding gains and losses on available-for-sale securities are
included as a separate component of accumulated other comprehensive income, net of income tax effect, until realized. At February 1, 2014, the Company did
not hold any held-to-maturity or available-for-sale securities.
Receivables
In connection with the sale of most of the Company’s credit assets to Citibank, the Company and Citibank entered into a long-term marketing and
servicing alliance pursuant to the terms of a Credit Card Program Agreement (the “Program Agreement”). Income earned under the Program Agreement is treated
as a reduction of selling, general and administrative ("SG&A") expenses on the Consolidated Statements of Income. Under the Program Agreement, Citibank
offers proprietary and non-proprietary credit to the Company’s customers through previously existing and newly opened accounts.
Loyalty Programs
The Company maintains customer loyalty programs in which customers earn rewards based on their spending. Upon reaching certain levels of
qualified spending, customers automatically receive rewards to apply toward future purchases. The Company recognizes the estimated net amount of the
rewards that will be earned and redeemed as a reduction to net sales.
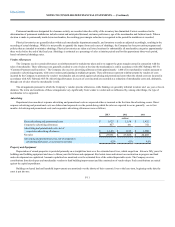
Merchandise Inventories
Merchandise inventories are valued at lower of cost or market using the last-in, first-out (LIFO) retail inventory method. Under the retail inventory
method, inventory is segregated into departments of merchandise having similar characteristics, and is stated at its current retail selling value. Inventory retail
values are converted to a cost basis by applying specific average cost factors for each merchandise department. Cost factors represent the average cost-to-retail
ratio for each merchandise department based on beginning inventory and the fiscal year purchase activity. At February 1, 2014 and February 2, 2013,
merchandise inventories valued at LIFO, including adjustments as necessary to record inventory at the lower of cost or market, approximated the cost of such
inventories using the first-in, first-out (FIFO) retail inventory method. The application of the LIFO retail inventory method did not result in the recognition of
any LIFO charges or credits affecting cost of sales for 2013, 2012 or 2011. The retail inventory method inherently requires management judgments and
estimates, such as the amount and timing of permanent markdowns to clear unproductive or slow-moving inventory, which may impact the ending inventory
valuation as well as gross margins.
F-10


