Macy's 2013 Annual Report Download - page 55
Download and view the complete annual report
Please find page 55 of the 2013 Macy's annual report below. You can navigate through the pages in the report by either clicking on the pages listed below, or by using the keyword search tool below to find specific information within the annual report.-
 1
1 -
2
-
3
-
4
-
5
-
6
-
7
-
8
-
9
-
10
-
11
-
12
-
13
-
14
-
15
-
16
-
17
-
18
-
19
-
20
-
21
-
22
-
23
-
24
-
25
-
26
-
27
-
28
-
29
-
30
-
31
-
32
-
33
-
34
-
35
-
36
-
37
-
38
-
39
-
40
-
41
-
42
-
43
-
44
-
 45
45 -
 46
46 -
 47
47 -
 48
48 -
 49
49 -
 50
50 -
 51
51 -
 52
52 -
 53
53 -
 54
54 -
 55
55 -
 56
56 -
 57
57 -
 58
58 -
 59
59 -
 60
60 -
 61
61 -
 62
62 -
 63
63 -
 64
64 -
 65
65 -
66
-
67
-
68
-
69
-
70
-
71
-
72
-
73
-
74
-
75
-
76
-
77
-
78
-
79
-
80
-
81
-
82
-
83
-
84
-
85
-
86
-
87
-
88
-
89
-
90
-
91
-
92
-
93
-
94
-
95
-
96
-
97
-
98
-
99
-
100
-
101
-
102
-
103
-
104
-
105
-
106
-
107
-
108
-
109
-
110
-
111
-
112
-
113
-
114
-
115
-
116
-
117
-
118
-
119
-
120
-
121
-
122
-
123
-
124
-
125
-
126
-
127
-
128
-
129
-
130
-
131
-
132
-
133
-
134
-
135
-
136
-
137
-
138
-
139
-
140
-
141
-
142
-
143
-
144
-
145
-
146
-
147
-
148
-
149
-
150
-
151
-
152
-
153
-
154
-
155
-
156
-
157
-
158
-
159
-
160
-
161
-
162
-
163
-
164
-
165
-
166
-
167
-
168
-
169
-
170
-
171
-
172
-
173
-
174
-
175
-
176
-
177
-
178
-
179
-
180
-
181
-
182
-
183
-
184
-
185
-
186
-
187
-
188
-
189
-
190
-
191
-
192
-
193
-
194
-
195
-
196
-
197
-
198
-
199
-
200
-
201
-
202
-
203
-
204
-
205
-
206
-
207
-
208
-
209
-
210
-
211
-
212
-
213
-
214
-
215
-
216
-
217
-
218
-
219
-
220
-
221
-
222
-
223
-
224
-
225
-
226
-
227
-
228
-
229
-
230
-
231
-
232
-
233
-
234
-
235
-
236
-
237
-
238
-
239
-
240
-
241
-
242
-
243
-
244
-
245
-
246
-
247
-
248
-
249
-
250
-
251
-
252
-
253
-
254
-
255
-
256
-
257
-
258
-
259
-
260
-
261
-
262
-
263
-
264
-
265
-
266
-
267
-
268
-
269
-
270
-
271
-
272
-
273
-
274
-
275
-
276
-
277
-
278
-
279
-
280
-
281
-
282
-
283
-
284
-
285
-
286
-
287
-
288
 |
 |

Table of Contents
Nature of Operations
Macy’s, Inc. and subsidiaries (the “Company”) is an omnichannel retail organization operating stores and Internet websites under two brands (Macy’s
and Bloomingdale’s) that sell a wide range of merchandise, including apparel and accessories (men's, women's and children's), cosmetics, home furnishings
and other consumer goods in 45 states, the District of Columbia, Guam and Puerto Rico. As of February 1, 2014, the Company’s operations and reportable
segments were conducted through Macy’s, macys.com, Bloomingdale’s, bloomingdales.com and Bloomingdale’s Outlet, which are aggregated into one
reporting segment in accordance with the Financial Accounting Standards Board (“FASB”) Accounting Standards Codification (“ASC”) Topic 280, “Segment
Reporting.” The metrics used by management to assess the performance of the Company’s operating divisions include sales trends, gross margin rates,
expense rates, and rates of earnings before interest and taxes (“EBIT”) and earnings before interest, taxes, depreciation and amortization (“EBITDA”). The
Company’s operating divisions have historically had similar economic characteristics and are expected to have similar economic characteristics and long-term
financial performance in future periods.
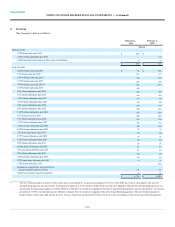
For 2013, 2012 and 2011, the following merchandise constituted the following percentages of sales:
Feminine Accessories, Intimate Apparel, Shoes and Cosmetics 38%
38%
37%
Feminine Apparel 23
23
25
Men’s and Children’s 23
23
23
Home/Miscellaneous 16
16
15
100%
100%
100%
Fiscal Year
The Company’s fiscal year ends on the Saturday closest to January 31. Fiscal years 2013, 2012 and 2011 ended on February 1, 2014, February 2,
2013 and January 28, 2012, respectively. Fiscal years 2013 and 2011 included 52 weeks and fiscal year 2012 included 53 weeks. References to years in the
Consolidated Financial Statements relate to fiscal years rather than calendar years.
Basis of Presentation
The Consolidated Financial Statements include the accounts of the Company and its 100%-owned subsidiaries. All significant intercompany
transactions have been eliminated.
Certain reclassifications were made to prior years’ amounts to conform with the classifications of such amounts for the most recent year.
Use of Estimates
The preparation of financial statements in conformity with accounting principles generally accepted in the United States of America requires
management to make estimates and assumptions that affect the reported amounts of assets and liabilities and disclosure of contingent assets and liabilities at
the date of the financial statements and the reported amounts of revenues and expenses during the reporting period. Such estimates and assumptions are subject
to inherent uncertainties, which may result in actual amounts differing from reported amounts.
F-9