Macy's 2013 Annual Report Download - page 28
Download and view the complete annual report
Please find page 28 of the 2013 Macy's annual report below. You can navigate through the pages in the report by either clicking on the pages listed below, or by using the keyword search tool below to find specific information within the annual report.-
 1
1 -
2
-
3
-
4
-
5
-
6
-
7
-
8
-
9
-
10
-
11
-
12
-
13
-
14
-
15
-
16
-
17
-
 18
18 -
 19
19 -
 20
20 -
 21
21 -
 22
22 -
 23
23 -
 24
24 -
 25
25 -
 26
26 -
 27
27 -
 28
28 -
 29
29 -
 30
30 -
 31
31 -
 32
32 -
 33
33 -
 34
34 -
 35
35 -
 36
36 -
 37
37 -
 38
38 -
39
-
40
-
41
-
42
-
43
-
44
-
45
-
46
-
47
-
48
-
49
-
50
-
51
-
52
-
53
-
54
-
55
-
56
-
57
-
58
-
59
-
60
-
61
-
62
-
63
-
64
-
65
-
66
-
67
-
68
-
69
-
70
-
71
-
72
-
73
-
74
-
75
-
76
-
77
-
78
-
79
-
80
-
81
-
82
-
83
-
84
-
85
-
86
-
87
-
88
-
89
-
90
-
91
-
92
-
93
-
94
-
95
-
96
-
97
-
98
-
99
-
100
-
101
-
102
-
103
-
104
-
105
-
106
-
107
-
108
-
109
-
110
-
111
-
112
-
113
-
114
-
115
-
116
-
117
-
118
-
119
-
120
-
121
-
122
-
123
-
124
-
125
-
126
-
127
-
128
-
129
-
130
-
131
-
132
-
133
-
134
-
135
-
136
-
137
-
138
-
139
-
140
-
141
-
142
-
143
-
144
-
145
-
146
-
147
-
148
-
149
-
150
-
151
-
152
-
153
-
154
-
155
-
156
-
157
-
158
-
159
-
160
-
161
-
162
-
163
-
164
-
165
-
166
-
167
-
168
-
169
-
170
-
171
-
172
-
173
-
174
-
175
-
176
-
177
-
178
-
179
-
180
-
181
-
182
-
183
-
184
-
185
-
186
-
187
-
188
-
189
-
190
-
191
-
192
-
193
-
194
-
195
-
196
-
197
-
198
-
199
-
200
-
201
-
202
-
203
-
204
-
205
-
206
-
207
-
208
-
209
-
210
-
211
-
212
-
213
-
214
-
215
-
216
-
217
-
218
-
219
-
220
-
221
-
222
-
223
-
224
-
225
-
226
-
227
-
228
-
229
-
230
-
231
-
232
-
233
-
234
-
235
-
236
-
237
-
238
-
239
-
240
-
241
-
242
-
243
-
244
-
245
-
246
-
247
-
248
-
249
-
250
-
251
-
252
-
253
-
254
-
255
-
256
-
257
-
258
-
259
-
260
-
261
-
262
-
263
-
264
-
265
-
266
-
267
-
268
-
269
-
270
-
271
-
272
-
273
-
274
-
275
-
276
-
277
-
278
-
279
-
280
-
281
-
282
-
283
-
284
-
285
-
286
-
287
-
288
 |
 |

Table of Contents
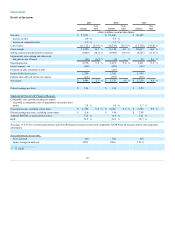
Impairments, Store Closing and Other Costs and Gain on Sale of Leases
Impairments, store closing and other costs and gain on sale of leases for 2012 included $4 million of asset impairment charges primarily related to the
store closings announced in January 2013. Impairments and store closing and other costs and gain on sale of leases for 2011 included a $54 million gain from
the sale of store leases related to the 2006 divestiture of Lord & Taylor, partially offset by $22 million of asset impairment charges primarily related to the
store closings announced in January 2012 and $7 million of other costs and expenses primarily related to the announced store closings.
Net Interest Expense
Net interest expense for 2012 decreased $21 million from 2011. Net interest expense for 2012 benefited from lower levels of borrowings and lower rates
on outstanding borrowings as compared to 2011.
Premium on Early Retirement of Debt
On November 28, 2012, the Company repurchased $700 million aggregate principal amount of its outstanding senior unsecured notes, which had a net
book value of $706 million. The repurchased senior unsecured notes had stated interest rates ranging from 5.9% to 7.875% and maturities in 2015 and
2016. The Company recorded the redemption premium and other costs related to these repurchases as additional interest expense of $133 million in 2012. On
March 29, 2012, the Company redeemed the $173 million of 8.0% senior debentures due July 15, 2012, as allowed under the terms of the indenture. The
price for the redemption was calculated pursuant to the indenture and resulted in the recognition of additional interest expense of $4 million in 2012. The
additional interest expense resulting from these transactions is presented as premium on early retirement of debt on the Consolidated Statements of Income.
Effective Tax Rate
The Company's effective tax rate of 36.5% for 2012 and 36.2% for 2011 differ from the federal income tax statutory rate of 35%, and on a comparative
basis, principally because of the effect of state and local income taxes, including the settlement of various tax issues and tax examinations.
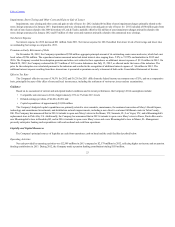
Guidance
Based on its assessment of current and anticipated market conditions and its recent performance, the Company's 2014 assumptions include:
•Comparable sales increase in 2014 of approximately 2.5% to 3% from 2013 levels;
•Diluted earnings per share of $4.40 to $4.50; and
•Capital expenditures of approximately $1,050 million.
The Company's budgeted capital expenditures are primarily related to store remodels, maintenance, the continued renovation of Macy's Herald Square,
technology and omnichannel investments, and distribution network improvements, including a new direct to customer fulfillment center in Tulsa County,
OK. The Company has announced that in 2014 it intends to open new Macy's stores in the Bronx, NY; Sarasota, FL; Las Vegas, NV; and a Bloomingdale's
replacement store in Palo Alto, CA. Additionally, the Company has announced that in 2015 it intends to open a new Macy's store in Ponce, Puerto Rico and a
new Bloomingdale's store in Honolulu, HI, and in 2016 it intends to open a new Macy's store and a new Bloomingdale's store in Miami, FL. Management
presently anticipates funding such expenditures with cash on hand and cash from operations.
Liquidity and Capital Resources
The Company's principal sources of liquidity are cash from operations, cash on hand and the credit facility described below.
Operating Activities
Net cash provided by operating activities was $2,549 million in 2013 compared to $2,179 million in 2012, reflecting higher net income and no pension
funding contribution in 2013. During 2012, the Company made a pension funding contribution totaling $150 million.
23