Macy's 2013 Annual Report Download - page 84
Download and view the complete annual report
Please find page 84 of the 2013 Macy's annual report below. You can navigate through the pages in the report by either clicking on the pages listed below, or by using the keyword search tool below to find specific information within the annual report.-
 1
1 -
2
-
3
-
4
-
5
-
6
-
7
-
8
-
9
-
10
-
11
-
12
-
13
-
14
-
15
-
16
-
17
-
18
-
19
-
20
-
21
-
22
-
23
-
24
-
25
-
26
-
27
-
28
-
29
-
30
-
31
-
32
-
33
-
34
-
35
-
36
-
37
-
38
-
39
-
40
-
41
-
42
-
43
-
44
-
45
-
46
-
47
-
48
-
49
-
50
-
51
-
52
-
53
-
54
-
55
-
56
-
57
-
58
-
59
-
60
-
61
-
62
-
63
-
64
-
65
-
66
-
67
-
68
-
69
-
70
-
71
-
72
-
73
-
 74
74 -
 75
75 -
 76
76 -
 77
77 -
 78
78 -
 79
79 -
 80
80 -
 81
81 -
 82
82 -
 83
83 -
 84
84 -
 85
85 -
 86
86 -
 87
87 -
 88
88 -
 89
89 -
 90
90 -
 91
91 -
 92
92 -
 93
93 -
 94
94 -
95
-
96
-
97
-
98
-
99
-
100
-
101
-
102
-
103
-
104
-
105
-
106
-
107
-
108
-
109
-
110
-
111
-
112
-
113
-
114
-
115
-
116
-
117
-
118
-
119
-
120
-
121
-
122
-
123
-
124
-
125
-
126
-
127
-
128
-
129
-
130
-
131
-
132
-
133
-
134
-
135
-
136
-
137
-
138
-
139
-
140
-
141
-
142
-
143
-
144
-
145
-
146
-
147
-
148
-
149
-
150
-
151
-
152
-
153
-
154
-
155
-
156
-
157
-
158
-
159
-
160
-
161
-
162
-
163
-
164
-
165
-
166
-
167
-
168
-
169
-
170
-
171
-
172
-
173
-
174
-
175
-
176
-
177
-
178
-
179
-
180
-
181
-
182
-
183
-
184
-
185
-
186
-
187
-
188
-
189
-
190
-
191
-
192
-
193
-
194
-
195
-
196
-
197
-
198
-
199
-
200
-
201
-
202
-
203
-
204
-
205
-
206
-
207
-
208
-
209
-
210
-
211
-
212
-
213
-
214
-
215
-
216
-
217
-
218
-
219
-
220
-
221
-
222
-
223
-
224
-
225
-
226
-
227
-
228
-
229
-
230
-
231
-
232
-
233
-
234
-
235
-
236
-
237
-
238
-
239
-
240
-
241
-
242
-
243
-
244
-
245
-
246
-
247
-
248
-
249
-
250
-
251
-
252
-
253
-
254
-
255
-
256
-
257
-
258
-
259
-
260
-
261
-
262
-
263
-
264
-
265
-
266
-
267
-
268
-
269
-
270
-
271
-
272
-
273
-
274
-
275
-
276
-
277
-
278
-
279
-
280
-
281
-
282
-
283
-
284
-
285
-
286
-
287
-
288
 |
 |

Table of Contents
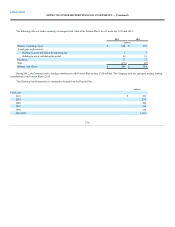
During 2013, 2012 and 2011, the CMD Committee approved awards of performance-based restricted stock units to certain senior executives of the
Company. Each award reflects a target number of shares (“Target Shares”) that may be issued to the award recipient. These awards may be earned upon the
completion of three-year performance periods ending January 30, 2016, January 31, 2015 and February 1, 2014, respectively. Whether units are earned at the
end of the performance period will be determined based on the achievement of certain performance objectives set by the CMD Committee in connection with the
issuance of the units. The performance objectives are based on the Company’s business plan covering the performance period. The performance objectives
include achieving a cumulative EBITDA level for the performance period and also include an EBITDA as a percent to sales ratio and a return on invested
capital ratio. The performance-based restricted stock units awarded during 2012 and 2013 also include a performance objective relating to relative total
shareholder return (“TSR”). Relative TSR reflects the change in the value of the Company’s common stock over the performance period in relation to the
change in the value of the common stock of a ten-company executive compensation peer group over the performance period, assuming the reinvestment of
dividends. Depending on the results achieved during the three-year performance periods, the actual number of shares that a grant recipient receives at the end of
the period may range from 0% to 150% of the Target Shares granted.
Also during 2013, 2012 and 2011, the CMD Committee approved awards of time-based restricted stock or time-based restricted stock units to certain
senior executives of the Company and awards of time-based restricted stock units to the non-employee members of the Company’s board of directors.
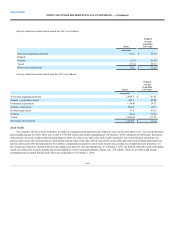
Stock Options
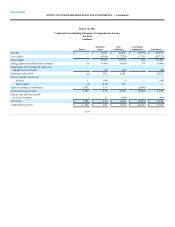
The fair value of stock options granted during 2013, 2012 and 2011 and the weighted average assumptions used to estimate the fair value are as follows:
Weighted average grant date fair value of stock options
granted during the period $12.15
$ 12.22
$ 7.12
Dividend yield 2.8%
2.2%
2.3%
Expected volatility 41.3%
39.8%
38.8%
Risk-free interest rate 0.8%
1.2%
2.0%
Expected life 5.7 years
5.7 years
5.6 years
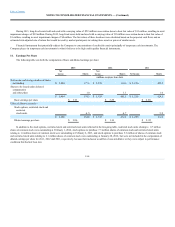
The fair value of each stock option grant is estimated on the date of grant using the Black-Scholes option-pricing model. The Company estimates the
expected volatility and expected option life assumption consistent with ASC Topic 718, “Compensation – Stock Compensation.” The expected volatility of the
Company’s common stock at the date of grant is estimated based on a historic volatility rate and the expected option life is calculated based on historical stock
option experience as the best estimate of future exercise patterns. The dividend yield assumption is based on historical and anticipated dividend payouts. The
risk-free interest rate assumption is based on observed interest rates consistent with the expected life of each stock option grant. The Company uses historical
data to estimate pre-vesting option forfeitures and records stock-based compensation expense only for those awards that are expected to vest. Compensation
expense is recorded for all stock options expected to vest based on the amortization of the fair value at the date of grant on a straight-line basis primarily over
the vesting period of the options.
F-38