Macy's 2013 Annual Report Download - page 68
Download and view the complete annual report
Please find page 68 of the 2013 Macy's annual report below. You can navigate through the pages in the report by either clicking on the pages listed below, or by using the keyword search tool below to find specific information within the annual report.-
 1
1 -
2
-
3
-
4
-
5
-
6
-
7
-
8
-
9
-
10
-
11
-
12
-
13
-
14
-
15
-
16
-
17
-
18
-
19
-
20
-
21
-
22
-
23
-
24
-
25
-
26
-
27
-
28
-
29
-
30
-
31
-
32
-
33
-
34
-
35
-
36
-
37
-
38
-
39
-
40
-
41
-
42
-
43
-
44
-
45
-
46
-
47
-
48
-
49
-
50
-
51
-
52
-
53
-
54
-
55
-
56
-
57
-
 58
58 -
 59
59 -
 60
60 -
 61
61 -
 62
62 -
 63
63 -
 64
64 -
 65
65 -
 66
66 -
 67
67 -
 68
68 -
 69
69 -
 70
70 -
 71
71 -
 72
72 -
 73
73 -
 74
74 -
 75
75 -
 76
76 -
 77
77 -
 78
78 -
79
-
80
-
81
-
82
-
83
-
84
-
85
-
86
-
87
-
88
-
89
-
90
-
91
-
92
-
93
-
94
-
95
-
96
-
97
-
98
-
99
-
100
-
101
-
102
-
103
-
104
-
105
-
106
-
107
-
108
-
109
-
110
-
111
-
112
-
113
-
114
-
115
-
116
-
117
-
118
-
119
-
120
-
121
-
122
-
123
-
124
-
125
-
126
-
127
-
128
-
129
-
130
-
131
-
132
-
133
-
134
-
135
-
136
-
137
-
138
-
139
-
140
-
141
-
142
-
143
-
144
-
145
-
146
-
147
-
148
-
149
-
150
-
151
-
152
-
153
-
154
-
155
-
156
-
157
-
158
-
159
-
160
-
161
-
162
-
163
-
164
-
165
-
166
-
167
-
168
-
169
-
170
-
171
-
172
-
173
-
174
-
175
-
176
-
177
-
178
-
179
-
180
-
181
-
182
-
183
-
184
-
185
-
186
-
187
-
188
-
189
-
190
-
191
-
192
-
193
-
194
-
195
-
196
-
197
-
198
-
199
-
200
-
201
-
202
-
203
-
204
-
205
-
206
-
207
-
208
-
209
-
210
-
211
-
212
-
213
-
214
-
215
-
216
-
217
-
218
-
219
-
220
-
221
-
222
-
223
-
224
-
225
-
226
-
227
-
228
-
229
-
230
-
231
-
232
-
233
-
234
-
235
-
236
-
237
-
238
-
239
-
240
-
241
-
242
-
243
-
244
-
245
-
246
-
247
-
248
-
249
-
250
-
251
-
252
-
253
-
254
-
255
-
256
-
257
-
258
-
259
-
260
-
261
-
262
-
263
-
264
-
265
-
266
-
267
-
268
-
269
-
270
-
271
-
272
-
273
-
274
-
275
-
276
-
277
-
278
-
279
-
280
-
281
-
282
-
283
-
284
-
285
-
286
-
287
-
288
 |
 |

Table of Contents
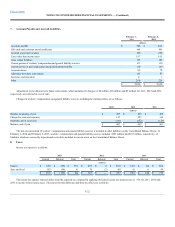
Accounts payable $ 746
$625
Gift cards and customer award certificates 840
801
Accrued wages and vacation 190
226
Taxes other than income taxes 157
195
Lease related liabilities 153
145
Current portion of workers’ compensation and general liability reserves 131
138
Current portion of post employment and postretirement benefits 110
100
Accrued interest 89
78
Allowance for future sales returns 85
81
Severance and relocation 43
3
Other 266
218
$ 2,810
$2,610
Adjustments to the allowance for future sales returns, which amounted to charges of $4 million, $5 million and $9 million for 2013, 2012 and 2011,
respectively, are reflected in cost of sales.
Changes in workers’ compensation and general liability reserves, including the current portion, are as follows:
Balance, beginning of year $ 497
$493
$488
Charged to costs and expenses 147
157
144
Payments, net of recoveries (147)
(153)
(139)
Balance, end of year $ 497
$ 497
$493
The non-current portion of workers’ compensation and general liability reserves is included in other liabilities on the Consolidated Balance Sheets. At
February 1, 2014 and February 2, 2013, workers’ compensation and general liability reserves included $107 million and $103 million, respectively, of
liabilities which are covered by deposits and receivables included in current assets on the Consolidated Balance Sheets.
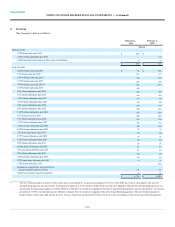
Income tax expense is as follows:
Federal $859
$ (98)
$761
$697
$ 2
$699
$519
$144
$663
State and local 107
(64)
43
70
(2)
68
43
6
49
$966
$ (162)
$804
$767
$ —
$767
$562
$ 150
$ 712
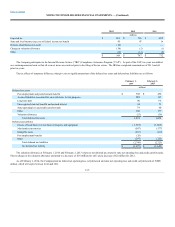
The income tax expense reported differs from the expected tax computed by applying the federal income tax statutory rate of 35% for 2013, 2012 and
2011 to income before income taxes. The reasons for this difference and their tax effects are as follows:
F-22