Macy's 2013 Annual Report Download - page 86
Download and view the complete annual report
Please find page 86 of the 2013 Macy's annual report below. You can navigate through the pages in the report by either clicking on the pages listed below, or by using the keyword search tool below to find specific information within the annual report.-
 1
1 -
2
-
3
-
4
-
5
-
6
-
7
-
8
-
9
-
10
-
11
-
12
-
13
-
14
-
15
-
16
-
17
-
18
-
19
-
20
-
21
-
22
-
23
-
24
-
25
-
26
-
27
-
28
-
29
-
30
-
31
-
32
-
33
-
34
-
35
-
36
-
37
-
38
-
39
-
40
-
41
-
42
-
43
-
44
-
45
-
46
-
47
-
48
-
49
-
50
-
51
-
52
-
53
-
54
-
55
-
56
-
57
-
58
-
59
-
60
-
61
-
62
-
63
-
64
-
65
-
66
-
67
-
68
-
69
-
70
-
71
-
72
-
73
-
74
-
75
-
 76
76 -
 77
77 -
 78
78 -
 79
79 -
 80
80 -
 81
81 -
 82
82 -
 83
83 -
 84
84 -
 85
85 -
 86
86 -
 87
87 -
 88
88 -
 89
89 -
 90
90 -
 91
91 -
 92
92 -
 93
93 -
 94
94 -
 95
95 -
 96
96 -
97
-
98
-
99
-
100
-
101
-
102
-
103
-
104
-
105
-
106
-
107
-
108
-
109
-
110
-
111
-
112
-
113
-
114
-
115
-
116
-
117
-
118
-
119
-
120
-
121
-
122
-
123
-
124
-
125
-
126
-
127
-
128
-
129
-
130
-
131
-
132
-
133
-
134
-
135
-
136
-
137
-
138
-
139
-
140
-
141
-
142
-
143
-
144
-
145
-
146
-
147
-
148
-
149
-
150
-
151
-
152
-
153
-
154
-
155
-
156
-
157
-
158
-
159
-
160
-
161
-
162
-
163
-
164
-
165
-
166
-
167
-
168
-
169
-
170
-
171
-
172
-
173
-
174
-
175
-
176
-
177
-
178
-
179
-
180
-
181
-
182
-
183
-
184
-
185
-
186
-
187
-
188
-
189
-
190
-
191
-
192
-
193
-
194
-
195
-
196
-
197
-
198
-
199
-
200
-
201
-
202
-
203
-
204
-
205
-
206
-
207
-
208
-
209
-
210
-
211
-
212
-
213
-
214
-
215
-
216
-
217
-
218
-
219
-
220
-
221
-
222
-
223
-
224
-
225
-
226
-
227
-
228
-
229
-
230
-
231
-
232
-
233
-
234
-
235
-
236
-
237
-
238
-
239
-
240
-
241
-
242
-
243
-
244
-
245
-
246
-
247
-
248
-
249
-
250
-
251
-
252
-
253
-
254
-
255
-
256
-
257
-
258
-
259
-
260
-
261
-
262
-
263
-
264
-
265
-
266
-
267
-
268
-
269
-
270
-
271
-
272
-
273
-
274
-
275
-
276
-
277
-
278
-
279
-
280
-
281
-
282
-
283
-
284
-
285
-
286
-
287
-
288
 |
 |
Table of Contents
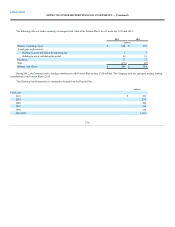
Activity related to restricted stock awards for 2013 is as follows:
Nonvested, beginning of period 142.3
$ 22.36
Granted —
—
Forfeited (5.7)
21.84
Vested (57.4)
22.11
Nonvested, end of period 79.2
$22.58
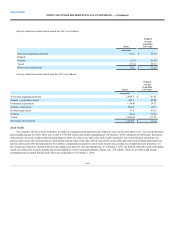
Activity related to restricted stock units for 2013 is as follows:
Nonvested, beginning of period 2,848.5
$26.61
Granted – performance-based 393.1
42.68
Performance adjustment (119.4)
39.37
Granted – time-based 264.9
42.33
Dividend equivalents 31.8
44.12
Forfeited (33.6)
34.54
Vested (1,164.4)
21.75
Nonvested, end of period 2,220.9
$33.32
Stock Credits
The Company also has a stock credit plan. In 2008, key management personnel became eligible to earn a stock credit grant over a two-year performance
period ending January 30, 2010. There were a total of 836,268 stock credit awards outstanding as of February 2, 2013, relating to the 2008 grant. In general,
with respect to the stock credits awarded to participants in 2008, the value of one-half of the stock credits earned plus reinvested dividend equivalents was
paid in cash in early 2012 and amounted to $28 million and the value of the other half of such earned stock credits plus reinvested dividend equivalents was
paid in cash in early 2013 and amounted to $32 million. Compensation expense for stock credit awards was recorded on a straight-line basis primarily over
the vesting period and was calculated based on the ending stock price for each reporting period. At February 2, 2013, the liability under the stock credit plans,
which was reflected in accounts payable and accrued liabilities on the Consolidated Balance Sheets, was $32 million. There are no stock credit awards
outstanding and no related liability under the stock credit plans as of February 1, 2014.
F-40