Kohl's 2015 Annual Report Download - page 24
Download and view the complete annual report
Please find page 24 of the 2015 Kohl's annual report below. You can navigate through the pages in the report by either clicking on the pages listed below, or by using the keyword search tool below to find specific information within the annual report.-
 1
1 -
2
-
3
-
4
-
5
-
6
-
7
-
8
-
9
-
10
-
11
-
12
-
13
-
 14
14 -
 15
15 -
 16
16 -
 17
17 -
 18
18 -
 19
19 -
 20
20 -
 21
21 -
 22
22 -
 23
23 -
 24
24 -
 25
25 -
 26
26 -
 27
27 -
 28
28 -
 29
29 -
 30
30 -
 31
31 -
 32
32 -
 33
33 -
 34
34 -
35
-
36
-
37
-
38
-
39
-
40
-
41
-
42
-
43
-
44
-
45
-
46
-
47
-
48
-
49
-
50
-
51
-
52
-
53
-
54
-
55
-
56
-
57
-
58
-
59
-
60
-
61
-
62
-
63
-
64
-
65
-
66
-
67
-
68
-
69
-
70
-
71
-
72
-
73
-
74
-
75
-
76
-
77
-
78
-
79
-
80
 |
 |
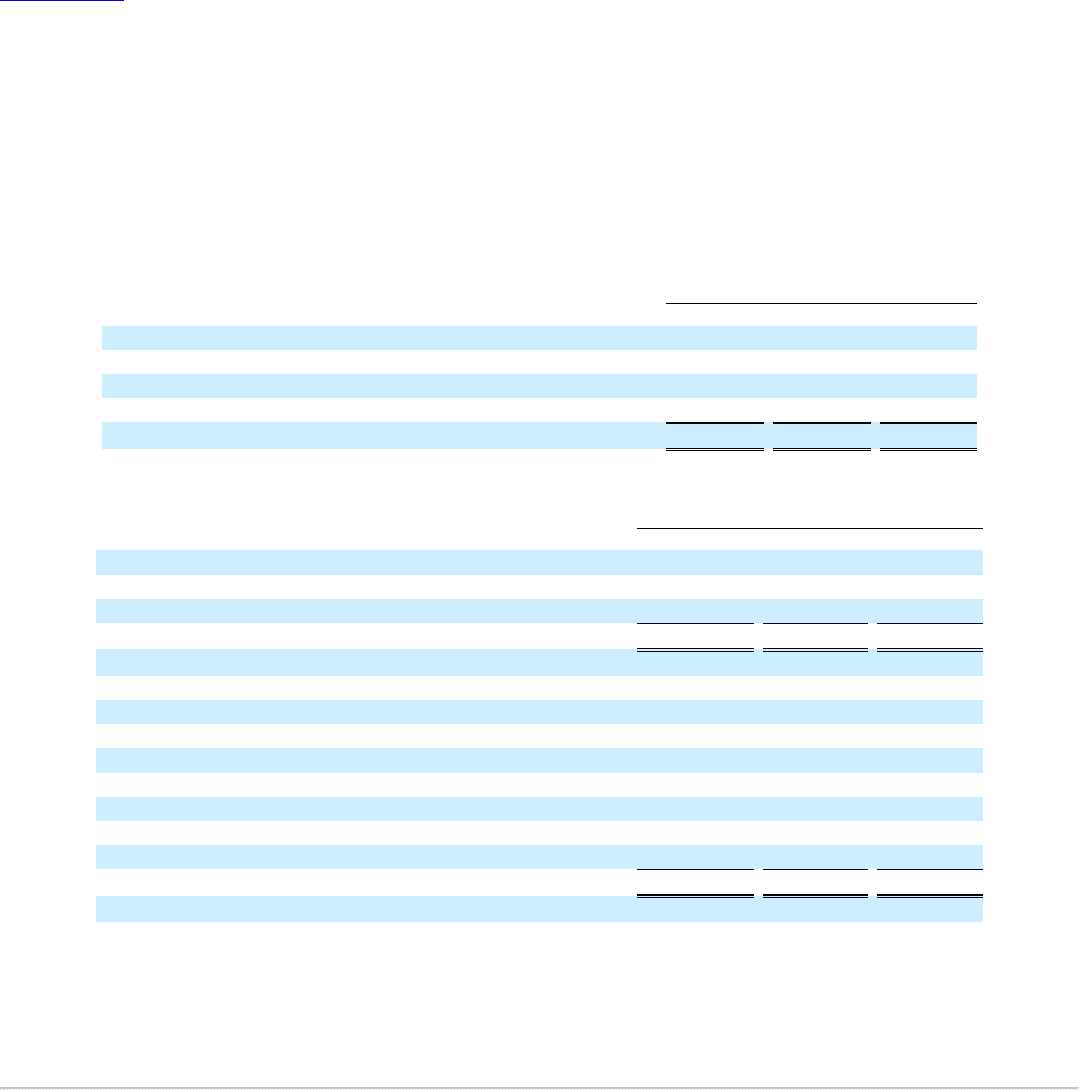
Table of Contents
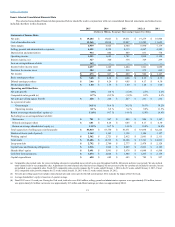
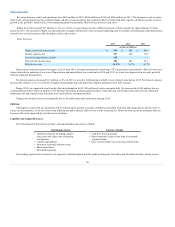
Our Adjusted Debt to EBITDAR ratio was 2.52 for 2015, 2.45 for 2014, and 2.42 for 2013. The increases are primarily due to lower EBITDAR. Adjusted
Debt to EBITDAR is a non-GAAP financial measure which we define as our adjusted outstanding debt balance divided by EBITDAR. We believe that our
debt levels are best analyzed using this measure. Our current goals are to maintain an Adjusted Debt to EBITDAR ratio of approximately 2.25, to manage
debt levels to maintain a BBB+ investment-grade credit rating and to operate with an efficient capital structure for our size, growth plans and industry. We are
currently exceeding our target goal to take advantage of a favorable, low interest rate debt environment. We expect to manage our business and debt levels to
get our overall ratio back to our target goal over the next several years. We currently have no plans for new debt in 2016. Our Adjusted Debt to EBITDAR
calculation may not be comparable to similarly-titled measures reported by other companies. Adjusted Debt to EBITDAR should be evaluated in addition to,
and not considered a substitute for, other financial measures such as debt/capitalization. See the key financial ratio calculations section below for our
Adjusted Debt to EBITDAR calculation.
Key financial ratio calculations
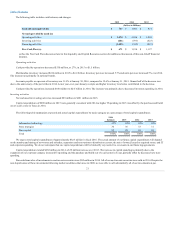
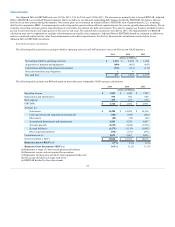
The following table reconciles net cash provided by operating activities (a GAAP measure) to free cash flow (a non-GAAP measure).
Net cash provided by operating activities
$ 2,024
$ 1,884
Acquisition of property and equipment
(682)
(643)
Capital lease and financing obligation payments
(114)
(115)
Proceeds from financing obligations
6
1
Free cash flow $ 1,234 $ 1,127
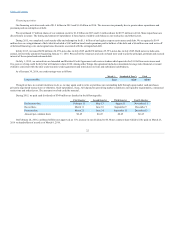
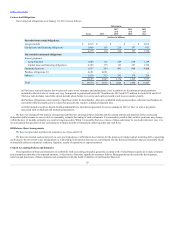
The following table includes our ROI and return on assets (the most comparable GAAP measure) calculations:
Operating income
$ 1,689
$ 1,742
Depreciation and amortization
886
889
Rent expense 277 270
EBITDAR $ 2,852 $ 2,901
Average: (a)
Total assets
$ 14,286
$ 14,196
Cash equivalents and long-term investments (b)
(647)
(382)
Other assets
(32)
(46)
Accumulated depreciation and amortization
5,743
5,457
Accounts payable
(1,624)
(1,556)
Accrued liabilities
(1,119)
(1,082)
Other long-term liabilities
(551)
(536)
Capitalized rent (c)
2,667
2,625
Gross Investment (“AGI”)
$ 18,723
$ 18,676
(d) 6.1% 6.3%
(e)
15.2%
15.5%
(a) Represents average of 5 most recent quarter end balances
(b) Represents excess cash not required for operations
(c) Represents 10 times store rent and 5 times equipment/other rent
(d) Net income divided by average total assets
(e) EBITDAR divided by Gross Investment
24