Kohl's 2015 Annual Report Download - page 23
Download and view the complete annual report
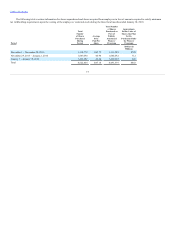
Please find page 23 of the 2015 Kohl's annual report below. You can navigate through the pages in the report by either clicking on the pages listed below, or by using the keyword search tool below to find specific information within the annual report.-
 1
1 -
2
-
3
-
4
-
5
-
6
-
7
-
8
-
9
-
10
-
11
-
12
-
 13
13 -
 14
14 -
 15
15 -
 16
16 -
 17
17 -
 18
18 -
 19
19 -
 20
20 -
 21
21 -
 22
22 -
 23
23 -
 24
24 -
 25
25 -
 26
26 -
 27
27 -
 28
28 -
 29
29 -
 30
30 -
 31
31 -
 32
32 -
 33
33 -
34
-
35
-
36
-
37
-
38
-
39
-
40
-
41
-
42
-
43
-
44
-
45
-
46
-
47
-
48
-
49
-
50
-
51
-
52
-
53
-
54
-
55
-
56
-
57
-
58
-
59
-
60
-
61
-
62
-
63
-
64
-
65
-
66
-
67
-
68
-
69
-
70
-
71
-
72
-
73
-
74
-
75
-
76
-
77
-
78
-
79
-
80
 |
 |

Table of Contents
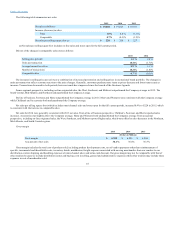
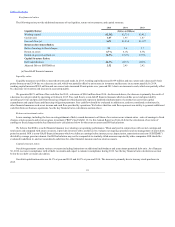
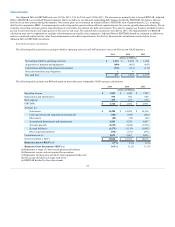
Key financial ratios
The following ratios provide additional measures of our liquidity, return on investments, and capital structure.
Working capital
$2,721
$2,412
Current ratio
1.95
1.87
Free cash flow (a)
$1,234
$1,127
Ratio of earnings to fixed charges
3.6
3.7
Return on assets
6.1%
6.3%
Return on gross investment (a)
15.2%
15.5%
Debt/capitalization
44.3%
44.8%
Adjusted Debt to EBITDAR (a)
2.45
2.42
(a) Non-GAAP financial measure
Liquidity ratios
Liquidity measures our ability to meet short-term cash needs. In 2015, working capital decreased $359 million and our current ratio decreased 8 basis
points from year-end 2014 due to a decrease in cash, which was partially offset by an increase in inventory and decrease in accounts payable. In 2014,
working capital increased $309 million and our current ratio increased 8 basis points over year-end 2013 due to an increase in cash, which was partially offset
by a decrease in inventory and increase in accounts payable.
We generated $671 million of free cash flow for 2015; a decrease of $563 million from 2014. As discussed above, the decrease is primarily the result of
a decrease in cash provided by operating activities in 2015. Free cash flow is a non-GAAP financial measure which we define as net cash provided by
operating activities and proceeds from financing obligations (which generally represent landlord reimbursements of construction costs) less capital
expenditures and capital lease and financing obligation payments. Free cash flow should be evaluated in addition to, and not considered a substitute for,
other financial measures such as net income and cash flow provided by operations. We believe that free cash flow represents our ability to generate additional
cash flow from our business operations. See the key financial ratio calculations section above.
Return on investment ratios
Lower earnings, including the loss on extinguishment of debt, caused decreases in all three of our return on investment ratios - ratio of earnings to fixed
charges, return on assets and return on gross investment ("ROI"). See Exhibit 12.1 to this Annual Report on Form 10-K for the calculation of our ratio of
earnings to fixed charges and the key financial ratio calculations below for the return on assets and ROI calculations.
We believe that ROI is a useful financial measure in evaluating our operating performance. When analyzed in conjunction with our net earnings and
total assets and compared with return on assets, it provides investors with a useful tool to evaluate our ongoing operations and our management of assets from
period to period. ROI is a non-GAAP financial measure which we define as earnings before interest, taxes, depreciation, amortization and rent (“EBITDAR”)
divided by average gross investment. Our ROI calculation may not be comparable to similarly-titled measures reported by other companies. ROI should be
evaluated in addition to, and not considered a substitute for, other financial measures such as return on assets.
Capital structure ratios
Our debt agreements contain various covenants including limitations on additional indebtedness and a maximum permitted debt ratio. As of January
30, 2016, we were in compliance with all debt covenants and expect to remain in compliance during 2016. See the key financial ratio calculations section
below for our debt covenant calculation.
Our debt/capitalization ratio was 46.3% at year-end 2015 and 44.3% at year-end 2014. The increase is primarily due to treasury stock purchases in
2015.
23