Kohl's 2015 Annual Report Download - page 20
Download and view the complete annual report
Please find page 20 of the 2015 Kohl's annual report below. You can navigate through the pages in the report by either clicking on the pages listed below, or by using the keyword search tool below to find specific information within the annual report.-
 1
1 -
2
-
3
-
4
-
5
-
6
-
7
-
8
-
9
-
 10
10 -
 11
11 -
 12
12 -
 13
13 -
 14
14 -
 15
15 -
 16
16 -
 17
17 -
 18
18 -
 19
19 -
 20
20 -
 21
21 -
 22
22 -
 23
23 -
 24
24 -
 25
25 -
 26
26 -
 27
27 -
 28
28 -
 29
29 -
 30
30 -
31
-
32
-
33
-
34
-
35
-
36
-
37
-
38
-
39
-
40
-
41
-
42
-
43
-
44
-
45
-
46
-
47
-
48
-
49
-
50
-
51
-
52
-
53
-
54
-
55
-
56
-
57
-
58
-
59
-
60
-
61
-
62
-
63
-
64
-
65
-
66
-
67
-
68
-
69
-
70
-
71
-
72
-
73
-
74
-
75
-
76
-
77
-
78
-
79
-
80
 |
 |

Table of Contents
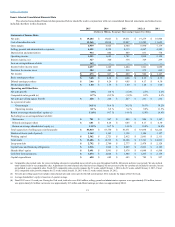
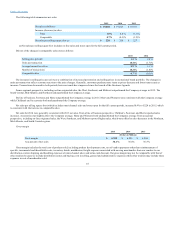
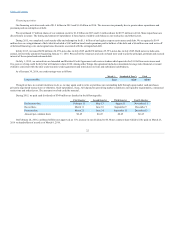
Revenues from our credit card operations were $456 million in 2015, $430 million in 2014 and $406 million in 2013. The increases in net revenues
from credit card operations are due to higher finance charge revenues and late fees, partially offset by higher bad debt expense, all which were the result of
growth in the portfolio. Additionally, lower marketing spend was partially offset by increased servicing costs.
SG&A for 2014 increased $37 million, or 1%, over 2013. As a percentage of sales, SG&A increased, or "deleveraged", by approximately 20 basis
points in 2014. The increase in SG&A was due primarily to higher distribution costs, increased marketing, and investments in technology and infrastructure
related to our on-line business, offset by higher credit card revenue.
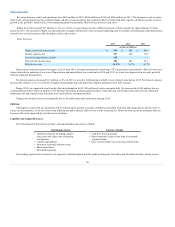
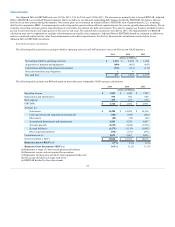
Other Expenses
Depreciation and amortization
$ 886
$ 889
Interest expense, net
340
338
Loss on extinguishment of debt
—
—
Provision for income taxes
482
515
Effective tax rate
35.7%
36.7%
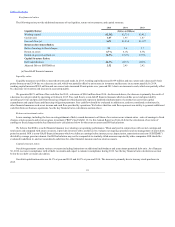
Depreciation and amortization was higher in 2015 than 2014, as higher information technology ("IT") amortization was partially offset by lower store
depreciation due to maturing of our stores. Depreciation and amortization was consistent in 2014 and 2013, as lower store depreciation was only partially
offset by higher IT amortization.
Net interest expense decreased $13 million, or 4%, in 2015 as a result of refinancing our debt at lower interest rates during 2015. Net interest expense
increased $2 million, or 1%, in 2014 due to higher outstanding long-term debt following the September 2013 debt issuance.
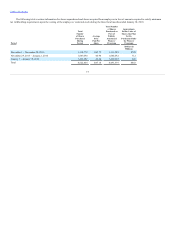
During 2015, we completed a cash tender offer and redemption for $1,085 million of senior unsecured debt. We recognized a $169 million loss on
extinguishment of debt which included a $163 million bond tender premium paid to holders of the debt and a $6 million non-cash write-off of deferred
financing costs and original issue discounts associated with the extinguished debt.
Changes in our effective tax were primarily due to favorable state audit settlements during 2014.
Although we expect that our operations will be influenced by general economic conditions, including food, fuel and energy prices, and by costs to
source our merchandise, we do not believe that inflation has had a material effect on our results of operations. However, there can be no assurance that our
business will not be impacted by such factors in the future.
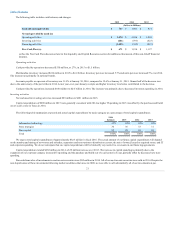
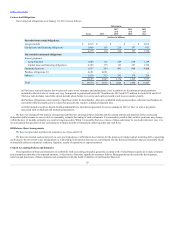
The following table presents the primary cash requirements and sources of funds.
• Operational needs, including salaries,
rent, taxes and other costs of running
our business
• Capital expenditures
• Inventory (seasonal and new store)
• Share repurchases
• Dividend payments
• Cash flow from operations
• Short-term trade credit, in the form of extended
payment terms
• Line of credit under our revolving credit facility
Our working capital and inventory levels typically build throughout the fall, peaking during the November and December holiday selling season.
20