Kohl's 2015 Annual Report Download - page 21
Download and view the complete annual report
Please find page 21 of the 2015 Kohl's annual report below. You can navigate through the pages in the report by either clicking on the pages listed below, or by using the keyword search tool below to find specific information within the annual report.-
 1
1 -
2
-
3
-
4
-
5
-
6
-
7
-
8
-
9
-
10
-
 11
11 -
 12
12 -
 13
13 -
 14
14 -
 15
15 -
 16
16 -
 17
17 -
 18
18 -
 19
19 -
 20
20 -
 21
21 -
 22
22 -
 23
23 -
 24
24 -
 25
25 -
 26
26 -
 27
27 -
 28
28 -
 29
29 -
 30
30 -
 31
31 -
32
-
33
-
34
-
35
-
36
-
37
-
38
-
39
-
40
-
41
-
42
-
43
-
44
-
45
-
46
-
47
-
48
-
49
-
50
-
51
-
52
-
53
-
54
-
55
-
56
-
57
-
58
-
59
-
60
-
61
-
62
-
63
-
64
-
65
-
66
-
67
-
68
-
69
-
70
-
71
-
72
-
73
-
74
-
75
-
76
-
77
-
78
-
79
-
80
 |
 |

Table of Contents
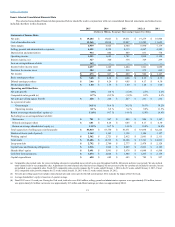
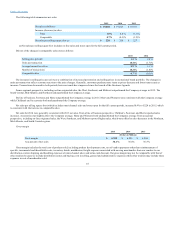
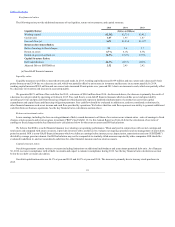
The following table includes cash balances and changes.
$ 1,407
$ 971
Operating activities
$ 2,024
$ 1,884
Investing activities
(593)
(623)
Financing activities
(995)
(827)
$ 1,234
$ 1,127
(a) See the Free Cash Flow discussion later in this Liquidity and Capital Resources section for additional discussion of this non-GAAP financial
measure.
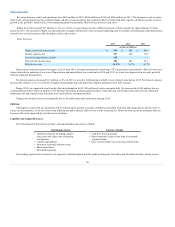
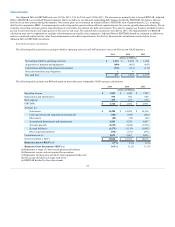
Operating activities
Cash provided by operations decreased $550 million, or 27%, in 2015 to $1.5 billion.
Merchandise inventory increased $224 million in 2015 to $4.0 billion. Inventory per store increased 5.7% and units per store increased 5% over 2014.
The increases are primarily in national brands.
Accounts payable as a percent of inventory was 31.0% at January 30, 2016, compared to 39.6% at January 31, 2015. Almost half of the decrease was
due to the anniversary of the port strike in 2014. Lower year-over-year January receipts and higher inventory levels also contributed to the decrease.
Cash provided by operations increased $140 million to $2.0 billion in 2014. The increase was primarily due to decreased inventory spending in 2014.
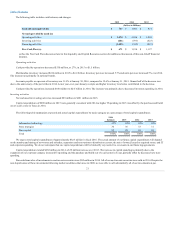
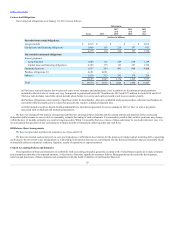
Investing activities
Net cash used in investing activities increased $88 million to $681 million in 2015.
Capital expenditures of $690 million in 2015 were generally consistent with 2014 as higher IT spending in 2015 was offset by the purchase and build
out of a call center in Texas in 2014.
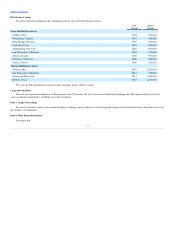
The following table summarizes expected and actual capital expenditures by major category as a percentage of total capital expenditures:
Information technology 45%
45%
45%
45%
Store strategies 30
36
33
31
Base capital 25
20
22
24
Total 100%
100%
100%
100%
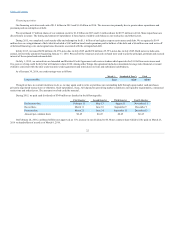
We expect total capital expenditures of approximately $825 million in fiscal 2016. The actual amount of our future capital expenditures will depend
on the number and timing of new stores and refreshes; expansion and renovations to distribution centers; the mix of owned, leased or acquired stores; and IT
and corporate spending. We do not anticipate that our capital expenditures will be limited by any restrictive covenants in our financing agreements.
Capital expenditures totaled $682 million in 2014, a $39 million increase over 2013. The increase in capital spending is primarily due to the
expansion of our corporate campus, increased IT spending and the purchase and build out of a call center in Texas, partially offset by decreased new store
spending.
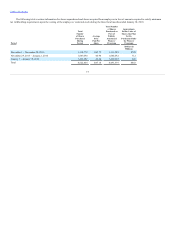
Proceeds from sales of investments in auction rate securities were $82 million in 2014. All of our auction rate securities were sold in 2014. Despite the
non-liquid nature of these investments following market conditions that arose in 2008, we were able to sell substantially all of our investments at par.
21