Kohl's 2015 Annual Report Download - page 18
Download and view the complete annual report
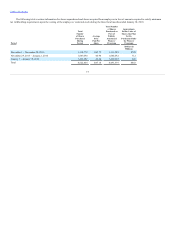
Please find page 18 of the 2015 Kohl's annual report below. You can navigate through the pages in the report by either clicking on the pages listed below, or by using the keyword search tool below to find specific information within the annual report.-
 1
1 -
2
-
3
-
4
-
5
-
6
-
7
-
 8
8 -
 9
9 -
 10
10 -
 11
11 -
 12
12 -
 13
13 -
 14
14 -
 15
15 -
 16
16 -
 17
17 -
 18
18 -
 19
19 -
 20
20 -
 21
21 -
 22
22 -
 23
23 -
 24
24 -
 25
25 -
 26
26 -
 27
27 -
 28
28 -
29
-
30
-
31
-
32
-
33
-
34
-
35
-
36
-
37
-
38
-
39
-
40
-
41
-
42
-
43
-
44
-
45
-
46
-
47
-
48
-
49
-
50
-
51
-
52
-
53
-
54
-
55
-
56
-
57
-
58
-
59
-
60
-
61
-
62
-
63
-
64
-
65
-
66
-
67
-
68
-
69
-
70
-
71
-
72
-
73
-
74
-
75
-
76
-
77
-
78
-
79
-
80
 |
 |

Table of Contents
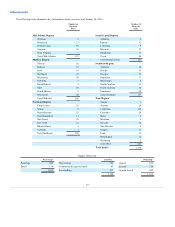
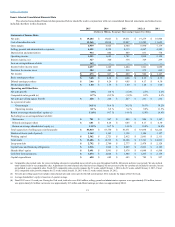
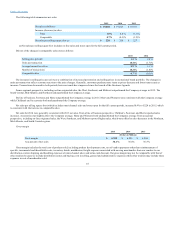
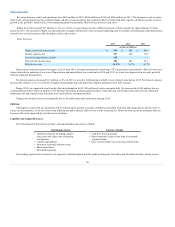
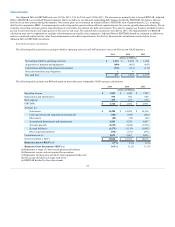
The following table summarizes net sales:
Net sales (in Millions)
$ 19,023
$ 19,031
Increase (decrease) in sales:
Total
0.0 %
(1.3)%
Comparable
(0.3)%
(1.2)%
Net sales per selling square foot (a)
$ 226
$ 227
(a) Net sales per selling square foot includes on-line sales and stores open for the full current period.
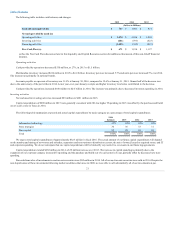
Drivers of the changes in comparable sales were as follows:
Selling price per unit
2.8 %
Units per transaction
(1.7)%
Average transaction value
1.1 %
Number of transactions
(1.4)%
Comparable sales
(0.3)%
The increases in selling price per unit were a combination of increased penetration and selling prices in our national brand portfolio. The changes in
units per transaction reflect customer reaction to the price changes. Generally, customers purchase more items as prices decrease and fewer items as prices
increase. Transactions decreased in both periods, however trends have improved since the launch of the Greatness Agenda.
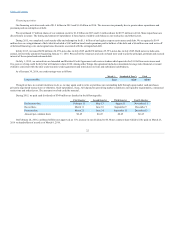
From a regional perspective, including on-line originated sales, the West, Southeast, and Midwest outperformed the Company average in 2015. The
South Central, Mid-Atlantic and Northeast underperformed the Company average.
By line of business, Footwear and Home outperformed the Company average in 2015. Men's and Women's were consistent with the Company average
while Children's and Accessories both underperformed the Company average.
Net sales per selling square foot (which includes omni-channel sales and stores open for the full current period), increased 0.9% to $228 in 2015, which
is consistent with the increase in comparable sales.
Net sales for 2014 were generally consistent with 2013 net sales. From a line of business perspective, Children's, Footwear, and Men's reported sales
increases. Accessories was slightly above the Company average. Home and Women's both underperformed the Company average. From a regional
perspective, including on-line originated sales, the West, Southeast, and Midwest reported higher sales, which were offset by sales decreases in the Northeast,
Mid-Atlantic, and South Central regions.
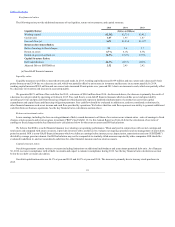
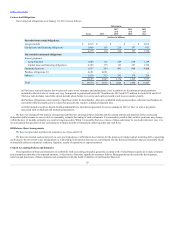
Gross margin
Gross margin
$ 6,925
$ 6,944
As a percent of net sales
36.4%
36.5%
Gross margin includes the total cost of products sold, including product development costs, net of vendor payments other than reimbursement of
specific, incremental and identifiable costs; inventory shrink; markdowns; freight expenses associated with moving merchandise from our vendors to our
distribution centers; shipping and handling expenses of omni-channel sales; and terms cash discount. Our gross margin may not be comparable with that of
other retailers because we include distribution center and buying costs in selling, general and administrative expenses while other retailers may include these
expenses in cost of merchandise sold.
18