Kohl's 2015 Annual Report Download - page 15
Download and view the complete annual report
Please find page 15 of the 2015 Kohl's annual report below. You can navigate through the pages in the report by either clicking on the pages listed below, or by using the keyword search tool below to find specific information within the annual report.-
 1
1 -
2
-
3
-
4
-
 5
5 -
 6
6 -
 7
7 -
 8
8 -
 9
9 -
 10
10 -
 11
11 -
 12
12 -
 13
13 -
 14
14 -
 15
15 -
 16
16 -
 17
17 -
 18
18 -
 19
19 -
 20
20 -
 21
21 -
 22
22 -
 23
23 -
 24
24 -
 25
25 -
26
-
27
-
28
-
29
-
30
-
31
-
32
-
33
-
34
-
35
-
36
-
37
-
38
-
39
-
40
-
41
-
42
-
43
-
44
-
45
-
46
-
47
-
48
-
49
-
50
-
51
-
52
-
53
-
54
-
55
-
56
-
57
-
58
-
59
-
60
-
61
-
62
-
63
-
64
-
65
-
66
-
67
-
68
-
69
-
70
-
71
-
72
-
73
-
74
-
75
-
76
-
77
-
78
-
79
-
80
 |
 |

Table of Contents
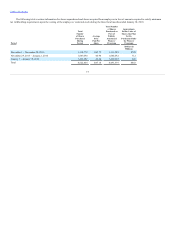
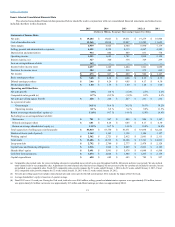
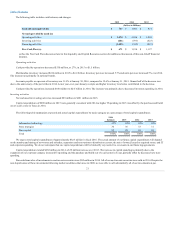
The selected consolidated financial data presented below should be read in conjunction with our consolidated financial statements and related notes
included elsewhere in this document.
(d)
Net sales
$ 19,023
$ 19,031
$ 19,279
$ 18,804
Cost of merchandise sold
12,098
12,087
12,289
11,625
Gross margin
6,925
6,944
6,990
7,179
Selling, general and administrative expenses
4,350
4,313
4,267
4,243
Depreciation and amortization
886
889
833
778
Operating income
1,689
1,742
1,890
2,158
Interest expense, net
340
338
329
299
Loss on extinguishment of debt
—
—
—
—
Income before income taxes
1,349
1,404
1,561
1,859
Provision for income taxes
482
515
575
692
Net income
$ 867
$ 889
$ 986
$ 1,167
Basic earnings per share
$ 4.28
$ 4.08
$ 4.19
$ 4.33
Diluted earnings per share
$ 4.24
$ 4.05
$ 4.17
$ 4.30
Dividends per share
$ 1.56
$ 1.40
$ 1.28
$ 1.00
Net sales growth
0.0 %
(1.3)%
2.5%
2.2%
Comparable sales growth (a)
(0.3)%
(1.2)%
0.3%
0.5%
Net sales per selling square foot (b)
$ 226
$ 227
$ 231
$ 232
As a percent of sales:
Gross margin
36.4 %
36.5 %
36.3%
38.2%
Operating income
8.9 %
9.2 %
9.8%
11.5%
Return on average shareholders’ equity (c)
14.7 %
14.8 %
15.8%
16.4%
Excluding loss on extinguishment of debt:
Net income
$ 867
$ 889
$ 986
$ 1,167
Diluted earnings per share
$ 4.24
$ 4.05
$ 4.17
$ 4.30
Return on average shareholders' equity (c)
14.7 %
14.8 %
15.8%
16.4%
Total square feet of selling space (in thousands)
$ 83,750
$ 83,671
$ 83,098
$ 82,226
Number of stores (end of period)
1,162
1,158
1,146
1,127
Working capital
$ 2,721
$ 2,412
$ 2,061
$ 2,111
Total assets
$ 14,333
$ 14,228
$ 13,761
$ 14,021
Long-term debt
$ 2,780
$ 2,777
$ 2,478
$ 2,128
Capital lease and financing obligations
1,968
$ 2,069
$ 2,061
$ 2,103
Shareholders’ equity
$ 5,991
$ 5,978
$ 6,048
$ 6,508
Cash flow from operations
$ 2,024
$ 1,884
$ 1,265
$ 2,139
Capital expenditures
$ 682
$ 643
$ 785
$ 927
(a) Comparable sales include sales for stores (including relocated or remodeled stores) which were open throughout both the full current and prior year periods. We also include
omni-channel sales in our comparable sales. Adjustments for omni-channel sales that have been shipped, but not yet received by the customer are included in net sales, but are
not included in our comparable sales. Fiscal 2013 comparable sales growth compares the 52 weeks ended February 1, 2014 to the 52 weeks ended February 2, 2013. Fiscal
2012 comparable sales growth compares the 52 weeks ended January 26, 2013 to the 52 weeks ended January 28, 2012.
(b) Net sales per selling square foot includes omni-channel sales and stores open for the full current period. 2012 excludes the impact of the 53rd week.
(c) Average shareholders’ equity is based on a 5-quarter average.
(d) Fiscal 2012 was a 53-week year. During the 53rd week, total sales were $169 million; selling, general and administrative expenses were approximately $30 million; interest
was approximately $2 million; net income was approximately $15 million and diluted earnings per share was approximately $0.06.
15