Kohl's 2015 Annual Report Download - page 19
Download and view the complete annual report
Please find page 19 of the 2015 Kohl's annual report below. You can navigate through the pages in the report by either clicking on the pages listed below, or by using the keyword search tool below to find specific information within the annual report.-
 1
1 -
2
-
3
-
4
-
5
-
6
-
7
-
8
-
 9
9 -
 10
10 -
 11
11 -
 12
12 -
 13
13 -
 14
14 -
 15
15 -
 16
16 -
 17
17 -
 18
18 -
 19
19 -
 20
20 -
 21
21 -
 22
22 -
 23
23 -
 24
24 -
 25
25 -
 26
26 -
 27
27 -
 28
28 -
 29
29 -
30
-
31
-
32
-
33
-
34
-
35
-
36
-
37
-
38
-
39
-
40
-
41
-
42
-
43
-
44
-
45
-
46
-
47
-
48
-
49
-
50
-
51
-
52
-
53
-
54
-
55
-
56
-
57
-
58
-
59
-
60
-
61
-
62
-
63
-
64
-
65
-
66
-
67
-
68
-
69
-
70
-
71
-
72
-
73
-
74
-
75
-
76
-
77
-
78
-
79
-
80
 |
 |

Table of Contents
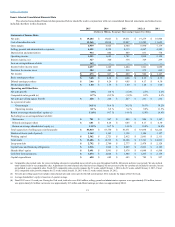
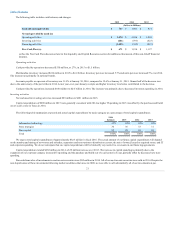
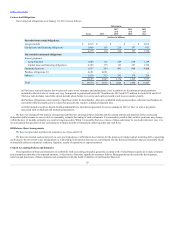
Gross margin as a percentage of sales decreased approximately 30 basis points from 36.4% in 2014 to 36.1% in 2015. The decrease was due to an
increase in shipping costs resulting from growth in on-line originated sales, partially offset by an increase in our merchandise margin.
Gross margin as a percentage of sales decreased approximately 10 basis points from 36.5% in 2013 to 36.4% in 2014. Higher merchandise margin was
more than offset by an increase in shipping costs, which was in line with our omni-channel business growth.
Selling, general and administrative expenses
Selling, general, and administrative expenses ("SG&A")
$ 4,350
$ 4,313
As a percent of net sales
22.9%
22.7%
SG&A expenses include compensation and benefit costs (including stores, headquarters, buying and merchandising and distribution centers);
occupancy and operating costs of our retail, distribution and corporate facilities; freight expenses associated with moving merchandise from our distribution
centers to our retail stores and among distribution and retail facilities; marketing expenses, offset by vendor payments for reimbursement of specific,
incremental and identifiable costs; net revenues from our Kohl’s credit card operations; and other administrative revenues and expenses. We do not include
depreciation and amortization in SG&A. The classification of these expenses varies across the retail industry.
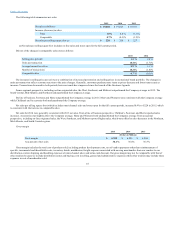
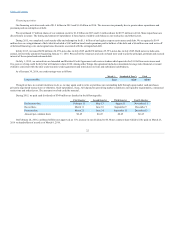
The following table summarizes the changes in SG&A by expense type:
Store expenses
$ (4)
Corporate expenses
34
Distribution costs
10
Marketing costs, excluding credit card operations
21
Net revenues from credit card operations
(24)
Total increase
$ 37
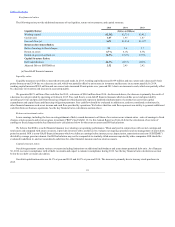
Many of our expenses, including store payroll and distribution costs, are variable in nature. These costs generally increase as sales increase and
decrease as sales decrease. We measure both the change in these variable expenses and the expense as a percent of sales. If the expense as a percent of sales
decreased from the prior year, the expense "leveraged" and indicates that the expense was well-managed or effectively generated additional sales. If the
expense as a percent of sales increased over the prior year, the expense "deleveraged" and indicates that sales growth was less than expense growth. SG&A as
a percent of sales increased, or "deleveraged," by approximately 30 basis points in 2015.
The increase in store expenses are primarily attributable to higher store payroll due to on-going wage pressure and omni-channel support of ship-from-
store and buy on-line, pick-up in store operations. Property taxes and common area maintenance also increased.
Corporate expense increased over 2014 due to technology and infrastructure investments related to our omni-channel strategy and other various
corporate costs.
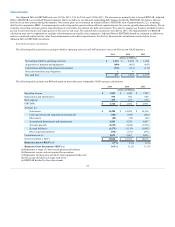
Distribution costs, which exclude payroll related to on-line originated orders that were shipped from our stores, were $278 million for 2015, $281
million for 2014 and $271 million for 2013. Distribution costs decreased in 2015 due to lower store distribution costs and were partially offset by higher
fulfillment costs related to our growing on-line business, particularly in the fourth quarter.
Marketing costs decreased in 2015 as we decreased our spending in newspaper inserts and direct mail through optimized circulation and shifted
spending to digital media.
19