Kodak 2004 Annual Report Download - page 87
Download and view the complete annual report
Please find page 87 of the 2004 Kodak annual report below. You can navigate through the pages in the report by either clicking on the pages listed below, or by using the keyword search tool below to find specific information within the annual report.-
 1
1 -
2
-
3
-
4
-
5
-
6
-
7
-
8
-
9
-
10
-
11
-
12
-
13
-
14
-
15
-
16
-
17
-
18
-
19
-
20
-
21
-
22
-
23
-
24
-
25
-
26
-
27
-
28
-
29
-
30
-
31
-
32
-
33
-
34
-
35
-
36
-
37
-
38
-
39
-
40
-
41
-
42
-
43
-
44
-
45
-
46
-
47
-
48
-
49
-
50
-
51
-
52
-
53
-
54
-
55
-
56
-
57
-
58
-
59
-
60
-
61
-
62
-
63
-
64
-
65
-
66
-
67
-
68
-
69
-
70
-
71
-
72
-
73
-
74
-
75
-
76
-
 77
77 -
 78
78 -
 79
79 -
 80
80 -
 81
81 -
 82
82 -
 83
83 -
 84
84 -
 85
85 -
 86
86 -
 87
87 -
 88
88 -
 89
89 -
 90
90 -
 91
91 -
 92
92 -
 93
93 -
 94
94 -
 95
95 -
 96
96 -
 97
97 -
98
-
99
-
100
-
101
-
102
-
103
-
104
-
105
-
106
-
107
-
108
-
109
-
110
-
111
-
112
-
113
-
114
-
115
-
116
-
117
-
118
-
119
-
120
-
121
-
122
-
123
-
124
-
125
-
126
-
127
-
128
-
129
-
130
-
131
-
132
-
133
-
134
-
135
-
136
-
137
-
138
-
139
-
140
-
141
-
142
-
143
-
144
-
145
-
146
-
147
-
148
-
149
-
150
-
151
-
152
-
153
-
154
-
155
-
156
-
157
-
158
-
159
-
160
-
161
-
162
-
163
-
164
-
165
-
166
-
167
-
168
-
169
-
170
-
171
-
172
-
173
-
174
-
175
-
176
-
177
-
178
-
179
-
180
-
181
-
182
-
183
-
184
-
185
-
186
-
187
-
188
-
189
-
190
-
191
-
192
 |
 |

Financials
85
2004 SUMMARY ANNUAL REPORT
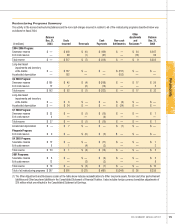
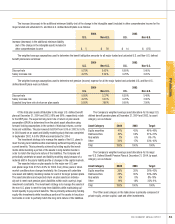
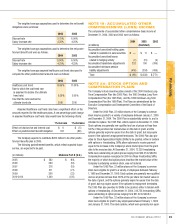
The weighted-average assumptions used to determine the net benefi t
obligations were as follows:
2004 2003
Discount rate 5.75% 6.00%
Salary increase rate 4.25% 4.25%
The weighted-average assumptions used to determine the net postre-
tirement benefi t cost were as follows:
2004 2003
Discount rate 6.00% 6.50%
Salary increase rate 4.25% 4.25%
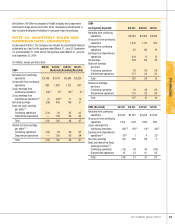
The weighted-average assumed healthcare cost trend rates used to
compute the other postretirement amounts were as follows:
2004 2003
Healthcare cost trend 10.00% 11.00%
Rate to which the cost trend rate
is assumed to decline (the ultimate
trend rate) 5.00% 5.00%
Year that the rate reaches the
ultimate trend rate 2010 2010
Assumed healthcare cost trend rates have a signifi cant effect on the
amounts reported for the healthcare plans. A one percentage point change
in assumed healthcare cost trend rates would have the following effects:
1% increase 1% decrease
Effect on total service and interest cost $ 6 $ (5)
Effect on postretirement benefi t obligation 103 (88)
The Company expects to contribute $282 million to its other postre-
tirement benefi ts plan in 2005.
The following postretirement benefi ts, which refl ect expected future
service, are expected to be paid.
(in millions) Medicare Part D (U.S.)
2005 $ 282 $ N/A
2006 280 (18)
2007 276 (19)
2008 271 (21)
2009 266 (22)
2010-2014 1,240 (125)
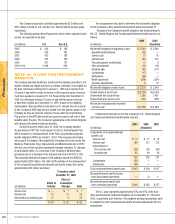
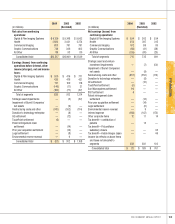
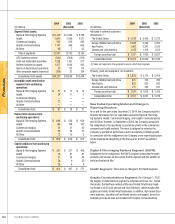
NOTE 19: ACCUMULATED OTHER
COMPREHENSIVE (LOSS) INCOME
The components of accumulated other comprehensive (loss) income at
December 31, 2004, 2003 and 2002 were as follows:
2004 2003 2002
(in millions) (Restated)
Accumulated unrealized holding gains
related to available-for-sale securities $ — $ 11 $ —
Accumulated unrealized losses
related to hedging activity (2) (15) (9)
Accumulated translations adjustments 328 100 (306)
Accumulated minimum pension
liability adjustments (416) (334) (456)
Total $ (90) $ (238) $ (771)
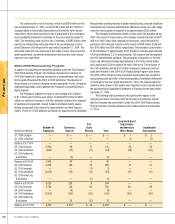
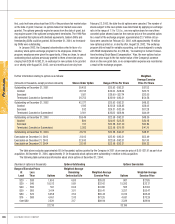
NOTE 20: STOCK OPTION AND
COMPENSATION PLANS
The Company’s stock incentive plans consist of the 2000 Omnibus Long-
Term Compensation Plan (the 2000 Plan), the 1995 Omnibus Long-Term
Compensation Plan (the 1995 Plan), and the 1990 Omnibus Long-Term
Compensation Plan (the 1990 Plan). The Plans are administered by the
Executive Compensation and Development Committee of the Board of
Directors.
Under the 2000 Plan, 22 million shares of the Company’s common
stock may be granted to a variety of employees between January 1, 2000
and December 31, 2004. The 2000 Plan is substantially similar to, and is
intended to replace, the 1995 Plan, which expired on December 31, 1999.
Stock options are generally non-qualifi ed and are at prices not less than
100% of the per share fair market value on the date of grant, and the
options generally expire ten years from the date of grant, but may expire
sooner if the optionee’s employment terminates. The 2000 Plan also pro-
vides for Stock Appreciation Rights (SARs) to be granted, either in tandem
with options or freestanding. SARs allow optionees to receive payment
equal to the increase in the Company’s stock market price from the grant
date to the exercise date. At December 31, 2004, 72,230 freestanding
SARs were outstanding at option prices ranging from $23.25 to $60.50.
Compensation expense recognized in 2004 on those freestanding SARs,
the majority of which had option prices less than the market value of the
Company’s underlying common stock, was not material.
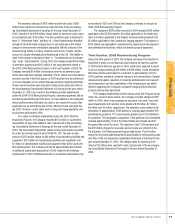
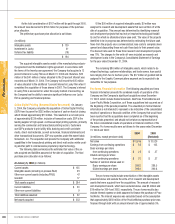
Under the 1995 Plan, 22 million shares of the Company’s common
stock were eligible for grant to a variety of employees between February
1, 1995 and December 31, 1999. Stock options are generally non-qualifi ed
and are at prices not less than 100% of the per share fair market value on
the date of grant, and the options generally expire ten years from the date
of grant, but may expire sooner if the optionee’s employment terminates.
The 1995 Plan also provides for SARs to be granted, either in tandem with
options or freestanding. At December 31, 2004, 316,723 freestanding SARs
were outstanding at option prices ranging from $31.30 to $90.63.
Under the 1990 Plan, 22 million shares of the Company’s common
stock were eligible for grant to key employees between February 1, 1990
and January 31, 1995. The stock options, which were generally non-quali-