Kodak 2004 Annual Report Download - page 16
Download and view the complete annual report
Please find page 16 of the 2004 Kodak annual report below. You can navigate through the pages in the report by either clicking on the pages listed below, or by using the keyword search tool below to find specific information within the annual report.-
 1
1 -
2
-
3
-
4
-
5
-
 6
6 -
 7
7 -
 8
8 -
 9
9 -
 10
10 -
 11
11 -
 12
12 -
 13
13 -
 14
14 -
 15
15 -
 16
16 -
 17
17 -
 18
18 -
 19
19 -
 20
20 -
 21
21 -
 22
22 -
 23
23 -
 24
24 -
 25
25 -
 26
26 -
27
-
28
-
29
-
30
-
31
-
32
-
33
-
34
-
35
-
36
-
37
-
38
-
39
-
40
-
41
-
42
-
43
-
44
-
45
-
46
-
47
-
48
-
49
-
50
-
51
-
52
-
53
-
54
-
55
-
56
-
57
-
58
-
59
-
60
-
61
-
62
-
63
-
64
-
65
-
66
-
67
-
68
-
69
-
70
-
71
-
72
-
73
-
74
-
75
-
76
-
77
-
78
-
79
-
80
-
81
-
82
-
83
-
84
-
85
-
86
-
87
-
88
-
89
-
90
-
91
-
92
-
93
-
94
-
95
-
96
-
97
-
98
-
99
-
100
-
101
-
102
-
103
-
104
-
105
-
106
-
107
-
108
-
109
-
110
-
111
-
112
-
113
-
114
-
115
-
116
-
117
-
118
-
119
-
120
-
121
-
122
-
123
-
124
-
125
-
126
-
127
-
128
-
129
-
130
-
131
-
132
-
133
-
134
-
135
-
136
-
137
-
138
-
139
-
140
-
141
-
142
-
143
-
144
-
145
-
146
-
147
-
148
-
149
-
150
-
151
-
152
-
153
-
154
-
155
-
156
-
157
-
158
-
159
-
160
-
161
-
162
-
163
-
164
-
165
-
166
-
167
-
168
-
169
-
170
-
171
-
172
-
173
-
174
-
175
-
176
-
177
-
178
-
179
-
180
-
181
-
182
-
183
-
184
-
185
-
186
-
187
-
188
-
189
-
190
-
191
-
192
 |
 |

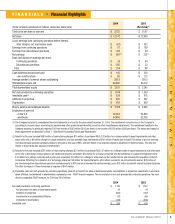
Financials
14
E A S T M A N K OD A K C O M PA N Y
year.Thesedecreaseswerepartiallyoffsetbyunfavorableexchangeof$69
millionandSG&Aexpenseofacquisitionsof$192million.
ResearchandDevelopmentCostsResearchanddevelopment(R&D)
costswere$854millionfor2004ascomparedwith$776millionfor2003,
representinganincreaseof$78million,or10%.TheincreaseinR&Dis
primarilyduetoincreasedspendingtodrivegrowthindigitalproductareas
aswellasacquisition-relatedR&D,partiallyoffsetbyreductionsinspend-
ingontraditionalproducts.Write-offsforin-processR&Dassociatedwith
acquisitionsmadeinthecurrentyearwere$15millioncomparedwith$31
millionintheprioryear.Asapercentageofsales,R&Dcostsremainedflat
at6%forboththecurrentandprioryears.
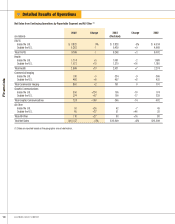
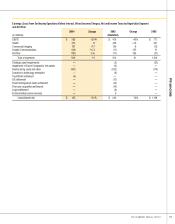
Earnings(Losses)FromContinuingOperationsBeforeInterest,
OtherIncome(Charges),NetandIncomeTaxesLossesfromcon-
tinuingoperationsbeforeinterest,otherincome(charges),netandincome
taxesfor2004were$87millionascomparedwithearningsof$302million
for2003,representingadecreaseof$389million,or129%.Thedecrease
isprimarilyattributabletothereasonsdescribedabove.
InterestExpenseInterestexpensefor2004was$168millionascom-
paredwith$147millionfor2003,representinganincreaseof$21million,
or14%.Theincreaseininterestexpenseisalmostentirelyattributableto
higheraverageinterestratesresultingfromthereplacementofcommercial
paperdebtwiththeSeniorNotesandConvertibleSeniorNotesissuedin
October2003.
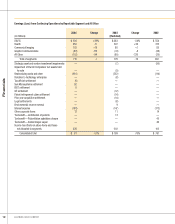
OtherIncome(Charges),NetTheotherincome(charges),netcompo-
nentincludesinvestmentincome,incomeandlossesfromequityinvest-
ments,gainsandlossesonforeignexchangeandonthesalesofassets
andinvestments,andothermiscellaneousincomeandexpenseitems.
Otherincomeforthecurrentyearwas$161millionascomparedwithanet
chargeof$51millionfor2003.Theincreaseinincomeisprimarilyattribut-
abletotheproceedsfromtwofavorablelegalsettlements,increasedin-
comefromtheCompany’sequityinvestmentinKodakPolychromeGraphics
(KPG),andintheprioryear,theNexPressinvestmentswereaccountedfor
undertheequitymethodandincludedinotherincome(charges),net.Asa
resultoftheCompany’spurchaseofHeidelberg’s50percentinterestinthe
NexPressjointventure,whichclosedinMay2004,NexPressisconsoli-
datedintheCompany’sStatementofEarningsfortheremainingportionof
theyearandincludedintheGraphicCommunicationssegment.
IncomeTaxProvision(Benefit)TheCompany’seffectivetaxbenefit
fromcontinuingoperationswas$175millionfortheyearendedDecember
31,2004,representinganeffectivetaxratebenefitfromcontinuingopera-
tionsof186%.Theeffectivetaxratebenefitfromcontinuingoperations
of186%differsfromtheU.S.statutorytaxrateof35%primarilydueto
earningsfromoperationsincertainlower-taxedjurisdictionsoutsidethe
U.S.,coupledwithlossesincurredincertainjurisdictionsthatarebenefited
atarateequaltoorgreaterthantheU.S.federalincometaxrate.
TheCompany’seffectivetaxbenefitfromcontinuingoperationswas
$85millionfortheyearendedDecember31,2003,representinganeffec-
tivetaxratebenefitfromcontinuingoperationsof82%,despitethefact
thattheCompanyhadpositiveearningsfromcontinuingoperationsbefore
incometaxes.Theeffectivetaxratebenefitfromcontinuingoperationsof
82%differsfromtheU.S.statutorytaxrateof35%primarilyduetoearn-
ingsfromoperationsincertainlower-taxedjurisdictionsoutsidetheU.S.,
coupledwithlossesincurredincertainjurisdictionsthatarebenefitedata
rateequaltoorgreaterthantheU.S.federalincometaxrate.
Excludingtheeffectofdiscreteperioditems,theeffectivetaxrate
fromcontinuingoperationswas18%and15.5%in2004and2003,
respectively.Theincreasefrom15.5%in2003to18%in2004isprimarily
duetoanincreaseininterestexpenseontaxreservesandanincreasein
valuationallowances.
EarningsFromContinuingOperationsNetearningsfromcontinuing
operationsfor2004were$81million,or$.28perbasicanddilutedshare,
ascomparedwithnetearningsfromcontinuingoperationsfor2003of
$189million,or$.66perbasicanddilutedshare,representingadecrease
of$108million,or57%.Thedecreaseinnetearningsfromcontinuing
operationsisprimarilyattributabletothereasonsoutlinedabove.
Digital&FilmImagingSystems
WorldwideRevenuesNetworldwidesalesfortheD&FISsegmentwere
$9,186millionfor2004ascomparedwith$9,248millionfor2003,repre-
sentingadecreaseof$62million,oradecreaseof1%asreported,ora
decreaseof4%excludingthefavorableimpactofexchange.Approximately
4.1percentagepointsofthedecreaseinnetsaleswasattributabletoprice/
mixdeclinesdrivenprimarilybydeclinesintraditionalfilmproductsaswell
asconsumerdigitalcamerasandinkjetmedia.Thisdecreasewaspartially
offsetbyfavorableexchange,whichincreasedrevenuesbyapproximately
3.2percentagepoints.
D&FISsegmentnetsalesintheU.S.were$3,823millionforthecur-
rentyearascomparedwith$3,828millionfortheprioryear,representing
adecreaseof$5million.D&FISsegmentnetsalesoutsidetheU.S.were
$5,363millionforthecurrentyearascomparedwith$5,420millionforthe
prioryear,representingadecreaseof$57million,or1%asreported,ora
decreaseof6%excludingthefavorableimpactofexchange.
DigitalStrategicProductGroups’RevenuesD&FISsegmentdigital
productsaleswere$2,677millionforthecurrentyearascomparedwith
$1,802millionfortheprioryear,representinganincreaseof$875million,
or49%,primarilydrivenbytheconsumerdigitalcaptureSPG.Networld-
widesalesofconsumerdigitalcaptureproducts,whichincludeconsumer
digitalcameras,accessories,memoryproducts,androyalties,increased
61%in2004ascomparedwith2003,primarilyreflectingstrongvolume
increasesandfavorableexchange,partiallyoffsetbynegativeprice/mix.
SalescontinuetobedrivenbystrongconsumeracceptanceoftheEasyShare
digitalcamerasystemandthesuccessofnewdigitalcameraproduct
introductionsduringthecurrentyear.
TheCompanygainedworldwidedigitalcameraunitmarketshare
whencomparedwiththeprioryear.Accordingtomarketresearchfirm
IDC’sfullyear2004digitalcamerastudy,Kodakleadstheindustryinthe
U.S.witha21.9%marketshare.Digitalcameramarketsharehasalso
improvedinternationally,givingKodakthenumberonemarketsharein
Australia,Argentina,PeruandChileaswellasputtingitamongthetop
threepositionsinGermany,UnitedKingdom,MexicoandBrazil.