Kodak 2004 Annual Report Download - page 22
Download and view the complete annual report
Please find page 22 of the 2004 Kodak annual report below. You can navigate through the pages in the report by either clicking on the pages listed below, or by using the keyword search tool below to find specific information within the annual report.-
 1
1 -
2
-
3
-
4
-
5
-
6
-
7
-
8
-
9
-
10
-
11
-
 12
12 -
 13
13 -
 14
14 -
 15
15 -
 16
16 -
 17
17 -
 18
18 -
 19
19 -
 20
20 -
 21
21 -
 22
22 -
 23
23 -
 24
24 -
 25
25 -
 26
26 -
 27
27 -
 28
28 -
 29
29 -
 30
30 -
 31
31 -
 32
32 -
33
-
34
-
35
-
36
-
37
-
38
-
39
-
40
-
41
-
42
-
43
-
44
-
45
-
46
-
47
-
48
-
49
-
50
-
51
-
52
-
53
-
54
-
55
-
56
-
57
-
58
-
59
-
60
-
61
-
62
-
63
-
64
-
65
-
66
-
67
-
68
-
69
-
70
-
71
-
72
-
73
-
74
-
75
-
76
-
77
-
78
-
79
-
80
-
81
-
82
-
83
-
84
-
85
-
86
-
87
-
88
-
89
-
90
-
91
-
92
-
93
-
94
-
95
-
96
-
97
-
98
-
99
-
100
-
101
-
102
-
103
-
104
-
105
-
106
-
107
-
108
-
109
-
110
-
111
-
112
-
113
-
114
-
115
-
116
-
117
-
118
-
119
-
120
-
121
-
122
-
123
-
124
-
125
-
126
-
127
-
128
-
129
-
130
-
131
-
132
-
133
-
134
-
135
-
136
-
137
-
138
-
139
-
140
-
141
-
142
-
143
-
144
-
145
-
146
-
147
-
148
-
149
-
150
-
151
-
152
-
153
-
154
-
155
-
156
-
157
-
158
-
159
-
160
-
161
-
162
-
163
-
164
-
165
-
166
-
167
-
168
-
169
-
170
-
171
-
172
-
173
-
174
-
175
-
176
-
177
-
178
-
179
-
180
-
181
-
182
-
183
-
184
-
185
-
186
-
187
-
188
-
189
-
190
-
191
-
192
 |
 |

Financials
20
E A S T M A N K OD A K C O M PA N Y
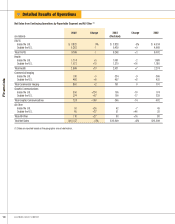
GrossProfitGrossprofitwas$4,175millionfor2003ascomparedwith
$4,527millionfor2002,representingadecreaseof$352million,or8%.
Thegrossprofitmarginwas32.3%in2003ascomparedwith36.1%in
2002.Thedecreaseof3.8percentagepointswasattributabletodeclines
inprice/mix,whichreducedgrossprofitmarginsbyapproximately5.1per-
centagepoints.Thisdecreasewasdrivenprimarilybyprice/mixdeclinesin
traditionalconsumerfilmproducts,photofinishing,consumerdigitalcam-
eras,andentertainmentprintfilmsintheD&FISsegment,analogmedical
filmanddigitalcaptureequipmentintheHealthsegment,andgraphicarts
productsintheGraphicCommunicationssegment.Thedeclineinprice/mix
waspartiallyoffsetbyfavorableexchange,whichincreasedgrossmargins
byapproximately0.8percentagepoints,anddecreasesinmanufacturing
cost,whichfavorablyimpactedgrossprofitmarginsbyapproximately0.3
percentagepointsyear-over-yearduetoreducedlaborexpense,favorable
materialspricingandimprovedproductyields.TheacquisitionofPractice-
Worksinthefourthquarterof2003didnothaveasignificantimpactonthe
grossprofitmargin.
Selling,GeneralandAdministrativeExpensesSG&Aexpenses
were$2,618millionfor2003ascomparedwith$2,504millionfor2002,
representinganincreaseof$114million,or5%.SG&Aremainedconsistent
asapercentageofsalesat20%forbothyears.ThenetincreaseinSG&Ais
primarilyattributabletoanincreaseinthebenefitrateandtheoccurrence
ofthefollowingone-timecharges:intellectualpropertysettlementof$12
million;patentinfringementclaimof$14million;settlementofoutstand-
ingissuesrelatingtoaprioryearacquisitionof$14million;write-downof
theBurrellCompanies’netassetsheldforsaleof$9million;donationtoa
technologyenterpriseforresearchpurposesamountingto$8million;legal
settlementof$8million;strategicassetimpairmentsof$3million;andunfa-
vorableexchangeof$118millionduetoanincreasedlevelofSG&Acostsin-
curredinnon-U.S.countriesasmostforeigncurrenciesstrengthenedagainst
theU.S.dollarin2003.Theseitemswerepartiallyoffsetbyareversalof
environmentalreservesof$9millionandcostsavingsrealizedfromposition
eliminationsassociatedwithongoingfocusedcostreductionprograms.
ResearchandDevelopmentCostsR&Dcostswere$776millionfor
2003ascomparedwith$757millionfor2002,representinganincreaseof
$19million,or3%.TheincreaseinR&Disprimarilydueto$31millionof
write-offsforpurchasedin-processR&Dassociatedwithtwoacquisitions
madein2003.Thesechargeswerepartiallyoffsetbycostsavingsrealized
frompositioneliminationsassociatedwithongoingfocusedcostreduction
programs.Asapercentageofsales,R&Dcostsremainedflatat6%for
both2003and2002.
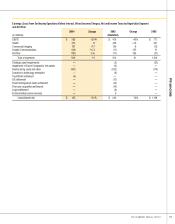
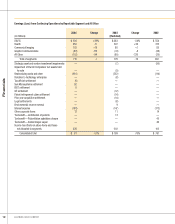
Earnings(Losses)FromContinuingOperationsBeforeInterest,
OtherIncome(Charges),NetandIncomeTaxesEarningsfrom
continuingoperationsbeforeinterest,otherincome(charges),netand
incometaxesfor2003were$302millionascomparedwith$1,168million
for2002,representingadecreaseof$866million,or74%.Thedecreaseis
primarilytheresultof(1)thedeclineingrossprofitmarginandanincrease
inSG&Aand(2)netfocusedcostreductionchargesof$479millionin-
curredduring2003ascomparedwith$98millionfor2002,anincreaseof
$381millionwhichwasprimarilyduetothecostsincurredundertheThird
Quarter,2003RestructuringProgram.
InterestExpenseInterestexpensefor2003was$147millionascom-
paredwith$173millionfor2002,representingadecreaseof$26million,
or15%.Thedecreaseininterestexpenseisalmostentirelyattributable
toloweraverageinterestratesin2003relativeto2002,whichwasdriven
mainlybytherefinancingoftheCompany’s$144million9.38%Notesdue
March2003andthe$110million7.36%NotesdueApril2003withlower
interestratemediumtermnotesandloweraverageinterestratesoncom-
mercialpaperduring2003.
OtherIncome(Charges),NetTheotherincome(charges),netcompo-
nentincludesprincipallyinvestmentincome,incomeandlossesfromequity
investments,foreignexchange,andgainsandlossesonthesalesofassets
andinvestments.Otherincome(charges),netfor2003wereanetcharge
of$51millionascomparedwithanetchargeof$101millionfor2002.
Thedecreaseinotherincome(charges),netisprimarilyattributableto
increasedincomefromtheCompany’sequityinvestmentinKPG,reduced
lossesfromtheCompany’sNexPressjointventure,theeliminationoflosses
fromtheCompany’sequityinvestmentinthePhogenixjointventuredue
toitsdissolutioninthesecondquarterof2003andlowernon-strategic
ventureinvestmentimpairments.
IncomeTaxProvision(Benefit)TheCompany’seffectivetaxbenefit
fromcontinuingoperationswas$85millionfortheyearendedDecember
31,2003,representinganeffectivetaxratebenefitfromcontinuingopera-
tionsof82%,despitethefactthattheCompanyhadpositiveearningsfrom
continuingoperationsbeforeincometaxes.Theeffectivetaxratebenefit
fromcontinuingoperationsof82%differsfromtheU.S.statutorytaxrate
of35%primarilyduetoearningsfromoperationsincertainlower-taxed
jurisdictionsoutsidetheU.S.,coupledwithlossesincurredincertainjuris-
dictionsthatarebenefitedatarateequaltoorgreaterthantheU.S.federal
incometaxrate.
TheCompany’seffectivetaxratefromcontinuingoperationswas15%
fortheyearendedDecember31,2002.Theeffectivetaxratefromcontinu-
ingoperationsof15%islessthantheU.S.statutoryrateof35%primarily
duetothechargesforthefocusedcostreductionsandassetimpairments
beingdeductedinjurisdictionsthathaveahighertaxratethantheU.S.
federalincometaxrate,andalsoduetodiscreteperiodtaxbenefitsof
$45millioninconnectionwiththeclosureoftheCompany’sPictureVision
subsidiaryand$46millionrelatingtotheconsolidationoftheCompany’s
photofinishingoperationsinJapanandthelossrealizedfromtheliquidation
ofasubsidiaryaspartofthatconsolidation.Thesebenefitswerepartially
offsetbytheimpactofrecordingavaluationallowancetoprovidefor
certaintaxbenefitsthattheCompanywouldberequiredtoforgoinorderto
fullyrealizethebenefitsofitsforeigntaxcreditcarryforwards.
Excludingtheeffectofdiscreteperioditems,theeffectivetaxrate
fromcontinuingoperationswas15.5%and26.5%in2003and2002,re-
spectively.Thedecreasefrom26.5%in2002to15.5%in2003isprimarily
duetoincreasedearningsincertainlower-taxedjurisdictionsoutsidethe
U.S.relativetototalconsolidatedearnings.
EarningsFromContinuingOperationsNetearningsfromcontinuing
operationsfor2003were$189million,or$.66perbasicanddilutedshare,
ascomparedwithnetearningsfromcontinuingoperationsfor2002of
$761million,or$2.61perbasicanddilutedshare,representingadecrease