Honeywell 2013 Annual Report Download - page 96
Download and view the complete annual report
Please find page 96 of the 2013 Honeywell annual report below. You can navigate through the pages in the report by either clicking on the pages listed below, or by using the keyword search tool below to find specific information within the annual report.-
 1
1 -
2
-
3
-
4
-
5
-
6
-
7
-
8
-
9
-
10
-
11
-
12
-
13
-
14
-
15
-
16
-
17
-
18
-
19
-
20
-
21
-
22
-
23
-
24
-
25
-
26
-
27
-
28
-
29
-
30
-
31
-
32
-
33
-
34
-
35
-
36
-
37
-
38
-
39
-
40
-
41
-
42
-
43
-
44
-
45
-
46
-
47
-
48
-
49
-
50
-
51
-
52
-
53
-
54
-
55
-
56
-
57
-
58
-
59
-
60
-
61
-
62
-
63
-
64
-
65
-
66
-
67
-
68
-
69
-
70
-
71
-
72
-
73
-
74
-
75
-
76
-
77
-
78
-
79
-
80
-
81
-
82
-
83
-
84
-
85
-
 86
86 -
 87
87 -
 88
88 -
 89
89 -
 90
90 -
 91
91 -
 92
92 -
 93
93 -
 94
94 -
 95
95 -
 96
96 -
 97
97 -
 98
98 -
 99
99 -
 100
100 -
 101
101 -
 102
102 -
 103
103 -
 104
104 -
 105
105 -
 106
106 -
107
-
108
-
109
-
110
-
111
-
112
-
113
-
114
-
115
-
116
-
117
-
118
-
119
-
120
-
121
-
122
-
123
-
124
-
125
-
126
-
127
-
128
-
129
-
130
-
131
-
132
-
133
-
134
-
135
-
136
-
137
-
138
-
139
-
140
-
141
-
142
-
143
-
144
-
145
-
146
 |
 |

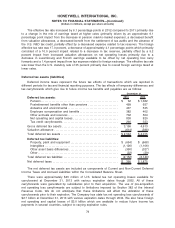
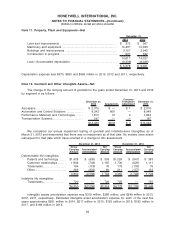
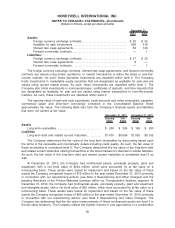
Note 11. Property, Plant and Equipment—Net
2013 2012
December 31,
Land and improvements . . . . . . . . . . . . . . . . . . . . . . . . . . . . . . . . . . . . . . . . . . $ 376 $ 367
Machinery and equipment. . . . . . . . . . . . . . . . . . . . . . . . . . . . . . . . . . . . . . . . . 10,437 10,023
Buildings and improvements . . . . . . . . . . . . . . . . . . . . . . . . . . . . . . . . . . . . . . 3,157 3,045
Construction in progress . . . . . . . . . . . . . . . . . . . . . . . . . . . . . . . . . . . . . . . . . . 647 592
14,617 14,027
Less—Accumulated depreciation . . . . . . . . . . . . . . . . . . . . . . . . . . . . . . . . . . (9,339) (9,026)
$ 5,278 $ 5,001
Depreciation expense was $670, $660 and $699 million in 2013, 2012 and 2011, respectively.
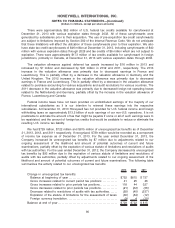
Note 12. Goodwill and Other Intangible Assets—Net
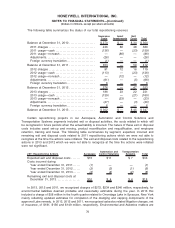
The change in the carrying amount of goodwill for the years ended December 31, 2013 and 2012
by segment is as follows:
December 31,
2012 Acquisitions
Currency
Translation
Adjustment
December 31,
2013
Aerospace. . . . . . . . . . . . . . . . . . . . . . . . . . . . . . . . . . . $ 2,075 $ — $ 1 $ 2,076
Automation and Control Solutions . . . . . . . . . . . . 8,343 606 — 8,949
Performance Materials and Technologies . . . . . 1,810 12 2 1,824
Transportation Systems . . . . . . . . . . . . . . . . . . . . . . 197 — — 197
$12,425 $618 $ 3 $13,046
We completed our annual impairment testing of goodwill and indefinite-lived intangibles as of
March 31, 2013 and determined that there was no impairment as of that date. No matters have arisen
subsequent to that date which have resulted in a change to this assessment.
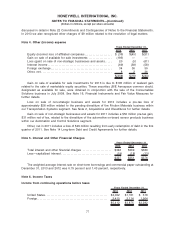
Gross
Carrying
Amount
Accumulated
Amortization
Net
Carrying
Amount
Gross
Carrying
Amount
Accumulated
Amortization
Net
Carrying
Amount
December 31, 2013 December 31, 2012
Determinable life intangibles:
Patents and technology . . . . . $1,438 $ (935) $ 503 $1,224 $ (841) $ 383
Customer relationships . . . . . . 1,904 (749) 1,155 1,736 (625) 1,111
Trademarks. . . . . . . . . . . . . . . . . 194 (118) 76 179 (103) 76
Other. . . . . . . . . . . . . . . . . . . . . . . 294 (234) 60 311 (157) 154
3,830 (2,036) 1,794 3,450 (1,726) 1,724
Indefinite life intangibles:
Trademarks. . . . . . . . . . . . . . . . . 720 — 720 725 — 725
$4,550 $(2,036) $2,514 $4,175 $(1,726) $2,449
Intangible assets amortization expense was $319 million, $266 million, and $249 million in 2013,
2012, 2011, respectively. Estimated intangible asset amortization expense for each of the next five
years approximates $261 million in 2014, $217 million in 2015, $193 million in 2016, $183 million in
2017, and $168 million in 2018.
84
HONEYWELL INTERNATIONAL INC.
NOTES TO FINANCIAL STATEMENTS—(Continued)
(Dollars in millions, except per share amounts)