Honeywell 2013 Annual Report Download - page 91
Download and view the complete annual report
Please find page 91 of the 2013 Honeywell annual report below. You can navigate through the pages in the report by either clicking on the pages listed below, or by using the keyword search tool below to find specific information within the annual report.-
 1
1 -
2
-
3
-
4
-
5
-
6
-
7
-
8
-
9
-
10
-
11
-
12
-
13
-
14
-
15
-
16
-
17
-
18
-
19
-
20
-
21
-
22
-
23
-
24
-
25
-
26
-
27
-
28
-
29
-
30
-
31
-
32
-
33
-
34
-
35
-
36
-
37
-
38
-
39
-
40
-
41
-
42
-
43
-
44
-
45
-
46
-
47
-
48
-
49
-
50
-
51
-
52
-
53
-
54
-
55
-
56
-
57
-
58
-
59
-
60
-
61
-
62
-
63
-
64
-
65
-
66
-
67
-
68
-
69
-
70
-
71
-
72
-
73
-
74
-
75
-
76
-
77
-
78
-
79
-
80
-
 81
81 -
 82
82 -
 83
83 -
 84
84 -
 85
85 -
 86
86 -
 87
87 -
 88
88 -
 89
89 -
 90
90 -
 91
91 -
 92
92 -
 93
93 -
 94
94 -
 95
95 -
 96
96 -
 97
97 -
 98
98 -
 99
99 -
 100
100 -
 101
101 -
102
-
103
-
104
-
105
-
106
-
107
-
108
-
109
-
110
-
111
-
112
-
113
-
114
-
115
-
116
-
117
-
118
-
119
-
120
-
121
-
122
-
123
-
124
-
125
-
126
-
127
-
128
-
129
-
130
-
131
-
132
-
133
-
134
-
135
-
136
-
137
-
138
-
139
-
140
-
141
-
142
-
143
-
144
-
145
-
146
 |
 |

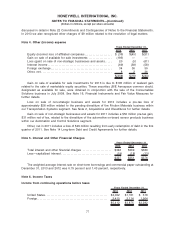
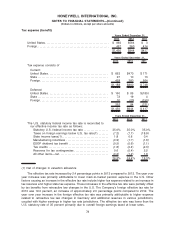
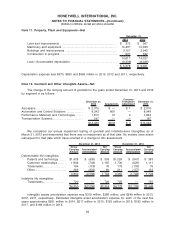
The effective tax rate increased by 6.1 percentage points in 2012 compared to 2011 primarily due
to a change in the mix of earnings taxed at higher rates (primarily driven by an approximate 6.1
percentage point impact from the decrease in pension mark-to-market expense), a decreased benefit
from valuation allowances, a decreased benefit from the settlement of tax audits and the absence of
the U.S. R&D tax credit, partially offset by a decreased expense related to tax reserves. The foreign
effective tax rate was 17.0 percent, a decrease of approximately 4.1 percentage points which primarily
consisted of a 10.0 percent impact related to a decrease in tax reserves, partially offset by a 5.2
percent impact from increased valuation allowances on net operating losses primarily due to a
decrease in Luxembourg and French earnings available to be offset by net operating loss carry
forwards and a 1.4 percent impact from tax expense related to foreign exchange. The effective tax rate
was lower than the U.S. statutory rate of 35 percent primarily due to overall foreign earnings taxed at
lower rates.
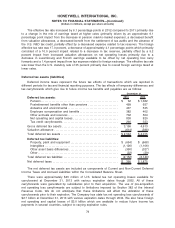
Deferred tax assets (liabilities)
Deferred income taxes represent the future tax effects of transactions which are reported in
different periods for tax and financial reporting purposes. The tax effects of temporary differences and
tax carryforwards which give rise to future income tax benefits and payables are as follows:
Deferred tax assets: 2013 2012
December 31,
Pension. . . . . . . . . . . . . . . . . . . . . . . . . . . . . . . . . . . . . . . . . . . . . . . . . . . . . . . . . $ 32 $ 1,362
Postretirement benefits other than pensions . . . . . . . . . . . . . . . . . . . . . . 499 657
Asbestos and environmental . . . . . . . . . . . . . . . . . . . . . . . . . . . . . . . . . . . . . 437 535
Employee compensation and benefits . . . . . . . . . . . . . . . . . . . . . . . . . . . . 382 402
Other accruals and reserves . . . . . . . . . . . . . . . . . . . . . . . . . . . . . . . . . . . . . 702 504
Net operating and capital losses . . . . . . . . . . . . . . . . . . . . . . . . . . . . . . . . . 838 820
Tax credit carryforwards . . . . . . . . . . . . . . . . . . . . . . . . . . . . . . . . . . . . . . . . . 266 333
Gross deferred tax assets . . . . . . . . . . . . . . . . . . . . . . . . . . . . . . . . . . . . . . . . . 3,156 4,613
Valuation allowance . . . . . . . . . . . . . . . . . . . . . . . . . . . . . . . . . . . . . . . . . . . . . . . (614) (598)
Total deferred tax assets . . . . . . . . . . . . . . . . . . . . . . . . . . . . . . . . . . . . . . . . . . $ 2,542 $ 4,015
Deferred tax liabilities:
Property, plant and equipment . . . . . . . . . . . . . . . . . . . . . . . . . . . . . . . . . . . $ (654) $ (668)
Intangibles . . . . . . . . . . . . . . . . . . . . . . . . . . . . . . . . . . . . . . . . . . . . . . . . . . . . . . (1,126) (1,106)
Other asset basis differences . . . . . . . . . . . . . . . . . . . . . . . . . . . . . . . . . . . . (350) (327)
Other . . . . . . . . . . . . . . . . . . . . . . . . . . . . . . . . . . . . . . . . . . . . . . . . . . . . . . . . . . . (22) (39)
Total deferred tax liabilities . . . . . . . . . . . . . . . . . . . . . . . . . . . . . . . . . . . . . . . . (2,152) (2,140)
Net deferred taxes . . . . . . . . . . . . . . . . . . . . . . . . . . . . . . . . . . . . . . . . . . . . . . . . $ 390 $ 1,875
The net deferred tax assets are included as components of Current and Non-Current Deferred
Income Taxes and Accrued Liabilities within the Consolidated Balance Sheet.
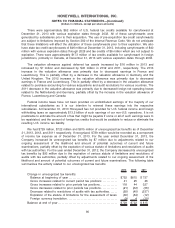
There were approximately $45 million of U.S. federal tax net operating losses available for
carryforward at December 31, 2013 with various expiration dates though 2032. All of these
carryforwards were generated by subsidiaries prior to their acquisition. The use of pre-acquisition
net operating loss carryforwards are subject to limitations imposed by Section 382 of the Internal
Revenue Code. We do not anticipate that these limitations will affect the utilization of these
carryforwards prior to their expiration. The Company has state tax net operating loss carryforwards of
$2.7 billion at December 31, 2013 with various expiration dates through 2034. We also have foreign
net operating and capital losses of $3.0 billion which are available to reduce future income tax
payments in several countries, subject to varying expiration rules.
79
HONEYWELL INTERNATIONAL INC.
NOTES TO FINANCIAL STATEMENTS—(Continued)
(Dollars in millions, except per share amounts)