Honeywell 2013 Annual Report Download - page 57
Download and view the complete annual report
Please find page 57 of the 2013 Honeywell annual report below. You can navigate through the pages in the report by either clicking on the pages listed below, or by using the keyword search tool below to find specific information within the annual report.-
 1
1 -
2
-
3
-
4
-
5
-
6
-
7
-
8
-
9
-
10
-
11
-
12
-
13
-
14
-
15
-
16
-
17
-
18
-
19
-
20
-
21
-
22
-
23
-
24
-
25
-
26
-
27
-
28
-
29
-
30
-
31
-
32
-
33
-
34
-
35
-
36
-
37
-
38
-
39
-
40
-
41
-
42
-
43
-
44
-
45
-
46
-
 47
47 -
 48
48 -
 49
49 -
 50
50 -
 51
51 -
 52
52 -
 53
53 -
 54
54 -
 55
55 -
 56
56 -
 57
57 -
 58
58 -
 59
59 -
 60
60 -
 61
61 -
 62
62 -
 63
63 -
 64
64 -
 65
65 -
 66
66 -
 67
67 -
68
-
69
-
70
-
71
-
72
-
73
-
74
-
75
-
76
-
77
-
78
-
79
-
80
-
81
-
82
-
83
-
84
-
85
-
86
-
87
-
88
-
89
-
90
-
91
-
92
-
93
-
94
-
95
-
96
-
97
-
98
-
99
-
100
-
101
-
102
-
103
-
104
-
105
-
106
-
107
-
108
-
109
-
110
-
111
-
112
-
113
-
114
-
115
-
116
-
117
-
118
-
119
-
120
-
121
-
122
-
123
-
124
-
125
-
126
-
127
-
128
-
129
-
130
-
131
-
132
-
133
-
134
-
135
-
136
-
137
-
138
-
139
-
140
-
141
-
142
-
143
-
144
-
145
-
146
 |
 |

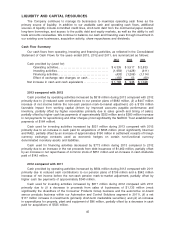
LIQUIDITY AND CAPITAL RESOURCES
The Company continues to manage its businesses to maximize operating cash flows as the
primary source of liquidity. In addition to our available cash and operating cash flows, additional
sources of liquidity include committed credit lines, short-term debt from the commercial paper market,
long-term borrowings, and access to the public debt and equity markets, as well as the ability to sell
trade accounts receivables. We continue to balance our cash and financing uses through investment in
our existing core businesses, acquisition activity, share repurchases and dividends.
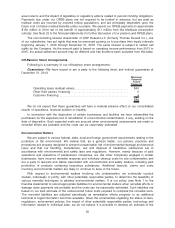
Cash Flow Summary
Our cash flows from operating, investing and financing activities, as reflected in the Consolidated
Statement of Cash Flows for the years ended 2013, 2012 and 2011, are summarized as follows:
2013 2012 2011
Cash provided by (used for):
Operating activities. . . . . . . . . . . . . . . . . . . . . . . . . . . . . . . . . . . . . $ 4,335 $ 3,517 $ 2,833
Investing activities. . . . . . . . . . . . . . . . . . . . . . . . . . . . . . . . . . . . . . (1,959) (1,428) (611)
Financing activities . . . . . . . . . . . . . . . . . . . . . . . . . . . . . . . . . . . . . (433) (1,206) (1,114)
Effect of exchange rate changes on cash . . . . . . . . . . . . . . . (155) 53 (60)
Net increase in cash and cash equivalents . . . . . . . . . . . . . . . . . . $ 1,788 $ 936 $ 1,048
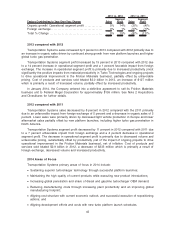
2013 compared with 2012
Cash provided by operating activities increased by $818 million during 2013 compared with 2012
primarily due to (i) reduced cash contributions to our pension plans of $883 million, (ii) a $447 million
increase of net income before the non-cash pension mark-to-market adjustment, (iii) a $135 million
favorable impact from working capital (driven by improved accounts payable performance and
inventory, partially offset by higher receivables primarily due to sales growth and timing of sales),
partially offset by higher cash tax payments of approximately $352 million and a $260 million increase
in net payments for repositioning and other charges (most significantly the NARCO Trust establishment
payments of $164 million).
Cash used for investing activities increased by $531 million during 2013 compared with 2012
primarily due to an increase in cash paid for acquisitions of $695 million (most significantly Intermec
and RAE), partially offset by an increase of approximately $190 million in settlement receipts of foreign
currency exchange contracts used as economic hedges on certain non-functional currency
denominated monetary assets and liabilities.
Cash used for financing activities decreased by $773 million during 2013 compared to 2012
primarily due to an increase in the net proceeds from debt issuances of $1,462 million, partially offset
by an increase in net repurchases of common stock of $651 million and an increase in cash dividends
paid of $142 million.
2012 compared with 2011
Cash provided by operating activities increased by $684 million during 2012 compared with 2011
primarily due to reduced cash contributions to our pension plans of $706 million and a $342 million
increase of net income before the non-cash pension mark-to-market adjustment, partially offset by
higher cash tax payments of approximately $340 million.
Cash used for investing activities increased by $817 million during 2012 compared with 2011
primarily due to (i) a decrease in proceeds from sales of businesses of $1,135 million (most
significantly the divestiture of the Consumer Products Group business and the automotive on-board
sensor products business within our Automation and Control Solutions segment in 2011), (ii) a net
$117 million increase in investments (primarily short-term marketable securities), and (iii) an increase
in expenditures for property, plant and equipment of $86 million, partially offset by a decrease in cash
paid for acquisitions of $535 million.
45