Honeywell 2013 Annual Report Download - page 132
Download and view the complete annual report
Please find page 132 of the 2013 Honeywell annual report below. You can navigate through the pages in the report by either clicking on the pages listed below, or by using the keyword search tool below to find specific information within the annual report.-
 1
1 -
2
-
3
-
4
-
5
-
6
-
7
-
8
-
9
-
10
-
11
-
12
-
13
-
14
-
15
-
16
-
17
-
18
-
19
-
20
-
21
-
22
-
23
-
24
-
25
-
26
-
27
-
28
-
29
-
30
-
31
-
32
-
33
-
34
-
35
-
36
-
37
-
38
-
39
-
40
-
41
-
42
-
43
-
44
-
45
-
46
-
47
-
48
-
49
-
50
-
51
-
52
-
53
-
54
-
55
-
56
-
57
-
58
-
59
-
60
-
61
-
62
-
63
-
64
-
65
-
66
-
67
-
68
-
69
-
70
-
71
-
72
-
73
-
74
-
75
-
76
-
77
-
78
-
79
-
80
-
81
-
82
-
83
-
84
-
85
-
86
-
87
-
88
-
89
-
90
-
91
-
92
-
93
-
94
-
95
-
96
-
97
-
98
-
99
-
100
-
101
-
102
-
103
-
104
-
105
-
106
-
107
-
108
-
109
-
110
-
111
-
112
-
113
-
114
-
115
-
116
-
117
-
118
-
119
-
120
-
121
-
 122
122 -
 123
123 -
 124
124 -
 125
125 -
 126
126 -
 127
127 -
 128
128 -
 129
129 -
 130
130 -
 131
131 -
 132
132 -
 133
133 -
 134
134 -
 135
135 -
 136
136 -
 137
137 -
 138
138 -
 139
139 -
 140
140 -
 141
141 -
 142
142 -
143
-
144
-
145
-
146
 |
 |

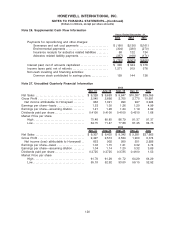
Note 26. Supplemental Cash Flow Information
2013 2012 2011
Years Ended December 31,
Payments for repositioning and other charges:
Severance and exit cost payments . . . . . . . . . . . . . . . . . . . . . $ (160) $(136) $(161)
Environmental payments . . . . . . . . . . . . . . . . . . . . . . . . . . . . . . . (304) (320) (270)
Insurance receipts for asbestos related liabilities . . . . . . . . 58 122 134
Asbestos related liability payments. . . . . . . . . . . . . . . . . . . . . . (357) (169) (171)
$ (763) $(503) $(468)
Interest paid, net of amounts capitalized . . . . . . . . . . . . . . . . . . . . $ 330 $ 344 $ 378
Income taxes paid, net of refunds . . . . . . . . . . . . . . . . . . . . . . . . . . 1,271 919 578
Non-cash investing and financing activities:
Common stock contributed to savings plans. . . . . . . . . . . . . 159 144 138
Note 27. Unaudited Quarterly Financial Information
Mar. 31 June 30 Sept. 30 Dec. 31 Year
2013
Net Sales . . . . . . . . . . . . . . . . . . . . . . . . . . . . . . . . . . . . $ 9,328 $ 9,693 $ 9,647 $10,387 $39,055
Gross Profit . . . . . . . . . . . . . . . . . . . . . . . . . . . . . . . . . . 2,545 2,666 2,705 2,775 10,691
Net income attributable to Honeywell . . . . . . . . 966 1,021 990 947 3,924
Earnings per share—basic . . . . . . . . . . . . . . . . . . . . 1.23 1.30 1.26 1.20 4.99
Earnings per share—assuming dilution . . . . . . . . . 1.21 1.28 1.24 1.19 4.92
Dividends paid per share . . . . . . . . . . . . . . . . . . . . . . 0.4100 0.4100 0.4100 0.4510 1.68
Market Price per share
High . . . . . . . . . . . . . . . . . . . . . . . . . . . . . . . . . . . . . 75.48 80.85 86.79 91.37 91.37
Low . . . . . . . . . . . . . . . . . . . . . . . . . . . . . . . . . . . . . . 64.75 71.47 77.88 81.45 64.75
Mar. 31 June 30 Sept. 30 Dec. 31 Year
2012
Net Sales . . . . . . . . . . . . . . . . . . . . . . . . . . . . . . . . . . . . $ 9,307 $ 9,435 $ 9,342 $ 9,581 $37,665
Gross Profit . . . . . . . . . . . . . . . . . . . . . . . . . . . . . . . . . . 2,427 2,513 2,534 1,900 9,374
Net income (loss) attributable to Honeywell . . 823 902 950 251 2,926
Earnings per share—basic . . . . . . . . . . . . . . . . . . . . 1.06 1.15 1.21 0.32 3.74
Earnings per share—assuming dilution . . . . . . . . . 1.04 1.14 1.20 0.32 3.69
Dividends paid per share . . . . . . . . . . . . . . . . . . . . . . 0.3725 0.3725 0.3725 0.4100 1.53
Market Price per share
High . . . . . . . . . . . . . . . . . . . . . . . . . . . . . . . . . . . . . 61.78 61.29 61.72 64.29 64.29
Low . . . . . . . . . . . . . . . . . . . . . . . . . . . . . . . . . . . . . . 55.18 52.92 53.60 59.15 52.92
120
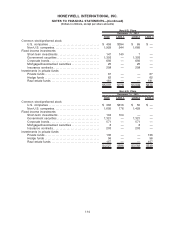
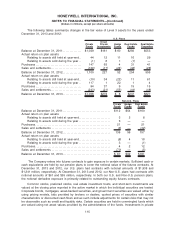
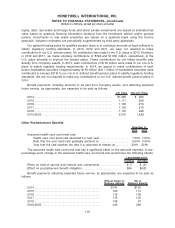
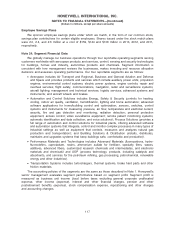
HONEYWELL INTERNATIONAL INC.
NOTES TO FINANCIAL STATEMENTS—(Continued)
(Dollars in millions, except per share amounts)