Honeywell 2013 Annual Report Download - page 45
Download and view the complete annual report
Please find page 45 of the 2013 Honeywell annual report below. You can navigate through the pages in the report by either clicking on the pages listed below, or by using the keyword search tool below to find specific information within the annual report.-
 1
1 -
2
-
3
-
4
-
5
-
6
-
7
-
8
-
9
-
10
-
11
-
12
-
13
-
14
-
15
-
16
-
17
-
18
-
19
-
20
-
21
-
22
-
23
-
24
-
25
-
26
-
27
-
28
-
29
-
30
-
31
-
32
-
33
-
34
-
 35
35 -
 36
36 -
 37
37 -
 38
38 -
 39
39 -
 40
40 -
 41
41 -
 42
42 -
 43
43 -
 44
44 -
 45
45 -
 46
46 -
 47
47 -
 48
48 -
 49
49 -
 50
50 -
 51
51 -
 52
52 -
 53
53 -
 54
54 -
 55
55 -
56
-
57
-
58
-
59
-
60
-
61
-
62
-
63
-
64
-
65
-
66
-
67
-
68
-
69
-
70
-
71
-
72
-
73
-
74
-
75
-
76
-
77
-
78
-
79
-
80
-
81
-
82
-
83
-
84
-
85
-
86
-
87
-
88
-
89
-
90
-
91
-
92
-
93
-
94
-
95
-
96
-
97
-
98
-
99
-
100
-
101
-
102
-
103
-
104
-
105
-
106
-
107
-
108
-
109
-
110
-
111
-
112
-
113
-
114
-
115
-
116
-
117
-
118
-
119
-
120
-
121
-
122
-
123
-
124
-
125
-
126
-
127
-
128
-
129
-
130
-
131
-
132
-
133
-
134
-
135
-
136
-
137
-
138
-
139
-
140
-
141
-
142
-
143
-
144
-
145
-
146
 |
 |

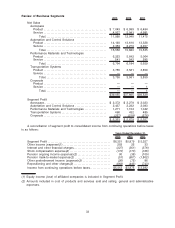
Review of Business Segments 2013 2012 2011
Net Sales
Aerospace
Product . . . . . . . . . . . . . . . . . . . . . . . . . . . . . . . . . . . . . . . . . . . . . . $ 7,043 $ 6,999 $ 6,494
Service . . . . . . . . . . . . . . . . . . . . . . . . . . . . . . . . . . . . . . . . . . . . . . 4,937 5,041 4,981
Total. . . . . . . . . . . . . . . . . . . . . . . . . . . . . . . . . . . . . . . . . . . . . 11,980 12,040 11,475
Automation and Control Solutions
Product . . . . . . . . . . . . . . . . . . . . . . . . . . . . . . . . . . . . . . . . . . . . . . 14,193 13,610 13,328
Service . . . . . . . . . . . . . . . . . . . . . . . . . . . . . . . . . . . . . . . . . . . . . . 2,363 2,270 2,207
Total. . . . . . . . . . . . . . . . . . . . . . . . . . . . . . . . . . . . . . . . . . . . . 16,556 15,880 15,535
Performance Materials and Technologies
Product . . . . . . . . . . . . . . . . . . . . . . . . . . . . . . . . . . . . . . . . . . . . . . 6,223 5,642 5,064
Service . . . . . . . . . . . . . . . . . . . . . . . . . . . . . . . . . . . . . . . . . . . . . . 541 542 595
Total. . . . . . . . . . . . . . . . . . . . . . . . . . . . . . . . . . . . . . . . . . . . . 6,764 6,184 5,659
Transportation Systems
Product . . . . . . . . . . . . . . . . . . . . . . . . . . . . . . . . . . . . . . . . . . . . . . 3,755 3,561 3,859
Service . . . . . . . . . . . . . . . . . . . . . . . . . . . . . . . . . . . . . . . . . . . . . . — — —
Total. . . . . . . . . . . . . . . . . . . . . . . . . . . . . . . . . . . . . . . . . . . . . 3,755 3,561 3,859
Corporate
Product . . . . . . . . . . . . . . . . . . . . . . . . . . . . . . . . . . . . . . . . . . . . . . — — —
Service . . . . . . . . . . . . . . . . . . . . . . . . . . . . . . . . . . . . . . . . . . . . . . — — 1
Total............................................. — — 1
$39,055 $37,665 $36,529
Segment Profit
Aerospace. . . . . . . . . . . . . . . . . . . . . . . . . . . . . . . . . . . . . . . . . . . . . . $ 2,372 $ 2,279 $ 2,023
Automation and Control Solutions . . . . . . . . . . . . . . . . . . . . . . . 2,437 2,232 2,083
Performance Materials and Technologies . . . . . . . . . . . . . . . . 1,271 1,154 1,042
Transportation Systems . . . . . . . . . . . . . . . . . . . . . . . . . . . . . . . . . 498 432 485
Corporate . . . . . . . . . . . . . . . . . . . . . . . . . . . . . . . . . . . . . . . . . . . . . . (227) (218) (276)
$ 6,351 $ 5,879 $ 5,357
A reconciliation of segment profit to consolidated income from continuing operations before taxes
is as follows:
2013 2012 2011
Years Ended December 31,
Segment Profit . . . . . . . . . . . . . . . . . . . . . . . . . . . . . . . . . . . . . . . . . . . . . . $6,351 $5,879 $ 5,357
Other income (expense)(1) . . . . . . . . . . . . . . . . . . . . . . . . . . . . . . . . . . . 202 25 33
Interest and other financial charges. . . . . . . . . . . . . . . . . . . . . . . . . . . (327) (351) (376)
Stock compensation expense(2) . . . . . . . . . . . . . . . . . . . . . . . . . . . . . . (170) (170) (168)
Pension ongoing income (expense)(2) . . . . . . . . . . . . . . . . . . . . . . . . 90 (36) (105)
Pension mark-to-market expense(2) . . . . . . . . . . . . . . . . . . . . . . . . . . (51) (957) (1,802)
Other postretirement income (expense)(2) . . . . . . . . . . . . . . . . . . . . (20) (72) 86
Repositioning and other charges(2) . . . . . . . . . . . . . . . . . . . . . . . . . . . (663) (443) (743)
Income from continuing operations before taxes. . . . . . . . . . . . . . . $5,412 $3,875 $ 2,282
(1) Equity income (loss) of affiliated companies is included in Segment Profit.
(2) Amounts included in cost of products and services sold and selling, general and administrative
expenses.
33