Honeywell 2013 Annual Report Download - page 74
Download and view the complete annual report
Please find page 74 of the 2013 Honeywell annual report below. You can navigate through the pages in the report by either clicking on the pages listed below, or by using the keyword search tool below to find specific information within the annual report.-
 1
1 -
2
-
3
-
4
-
5
-
6
-
7
-
8
-
9
-
10
-
11
-
12
-
13
-
14
-
15
-
16
-
17
-
18
-
19
-
20
-
21
-
22
-
23
-
24
-
25
-
26
-
27
-
28
-
29
-
30
-
31
-
32
-
33
-
34
-
35
-
36
-
37
-
38
-
39
-
40
-
41
-
42
-
43
-
44
-
45
-
46
-
47
-
48
-
49
-
50
-
51
-
52
-
53
-
54
-
55
-
56
-
57
-
58
-
59
-
60
-
61
-
62
-
63
-
 64
64 -
 65
65 -
 66
66 -
 67
67 -
 68
68 -
 69
69 -
 70
70 -
 71
71 -
 72
72 -
 73
73 -
 74
74 -
 75
75 -
 76
76 -
 77
77 -
 78
78 -
 79
79 -
 80
80 -
 81
81 -
 82
82 -
 83
83 -
 84
84 -
85
-
86
-
87
-
88
-
89
-
90
-
91
-
92
-
93
-
94
-
95
-
96
-
97
-
98
-
99
-
100
-
101
-
102
-
103
-
104
-
105
-
106
-
107
-
108
-
109
-
110
-
111
-
112
-
113
-
114
-
115
-
116
-
117
-
118
-
119
-
120
-
121
-
122
-
123
-
124
-
125
-
126
-
127
-
128
-
129
-
130
-
131
-
132
-
133
-
134
-
135
-
136
-
137
-
138
-
139
-
140
-
141
-
142
-
143
-
144
-
145
-
146
 |
 |

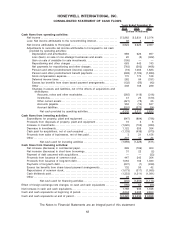
HONEYWELL INTERNATIONAL INC.
CONSOLIDATED STATEMENT OF CASH FLOWS
2013 2012 2011
Years Ended December 31,
(Dollars in millions)
Cash flows from operating activities:
Net income . . . . . . . . . . . . . . . . . . . . . . . . . . . . . . . . . . . . . . . . . . . . . . . . . . . . . . . . . . . . . . $ 3,962 $ 2,931 $ 2,074
Less: Net income attributable to the noncontrolling interest . . . . . . . . . . . . . . . . . 38 5 7
Net income attributable to Honeywell . . . . . . . . . . . . . . . . . . . . . . . . . . . . . . . . . . . . . . 3,924 2,926 2,067
Adjustments to reconcile net income attributable to Honeywell to net cash
provided by operating activities:
Depreciation and amortization. . . . . . . . . . . . . . . . . . . . . . . . . . . . . . . . . . . . . . . . . 989 926 957
Loss (Gain) on sale of non-strategic businesses and assets. . . . . . . . . . . . 20 (5) (362)
Gain on sale of available for sale investments . . . . . . . . . . . . . . . . . . . . . . . . . (195) — —
Repositioning and other charges . . . . . . . . . . . . . . . . . . . . . . . . . . . . . . . . . . . . . . 663 443 743
Net payments for repositioning and other charges . . . . . . . . . . . . . . . . . . . . . (763) (503) (468)
Pension and other postretirement (income) expense . . . . . . . . . . . . . . . . . . . (19) 1,065 1,823
Pension and other postretirement benefit payments . . . . . . . . . . . . . . . . . . . . (298) (1,183) (1,883)
Stock compensation expense . . . . . . . . . . . . . . . . . . . . . . . . . . . . . . . . . . . . . . . . . 170 170 168
Deferred income taxes . . . . . . . . . . . . . . . . . . . . . . . . . . . . . . . . . . . . . . . . . . . . . . . 262 84 (331)
Excess tax benefits from share based payment arrangements. . . . . . . . . . (132) (56) (42)
Other................................................................ 308 108 289
Changes in assets and liabilities, net of the effects of acquisitions and
divestitures:
Accounts, notes and other receivables . . . . . . . . . . . . . . . . . . . . . . . . . . . . (365) (119) (316)
Inventories. . . . . . . . . . . . . . . . . . . . . . . . . . . . . . . . . . . . . . . . . . . . . . . . . . . . . . . 41 25 (310)
Other current assets . . . . . . . . . . . . . . . . . . . . . . . . . . . . . . . . . . . . . . . . . . . . . (421) (78) 25
Accounts payable . . . . . . . . . . . . . . . . . . . . . . . . . . . . . . . . . . . . . . . . . . . . . . . . 352 (13) 527
Accrued liabilities . . . . . . . . . . . . . . . . . . . . . . . . . . . . . . . . . . . . . . . . . . . . . . . . (201) (273) (54)
Net cash provided by operating activities. . . . . . . . . . . . . . . . . . . . . . . . 4,335 3,517 2,833
Cash flows from investing activities:
Expenditures for property, plant and equipment . . . . . . . . . . . . . . . . . . . . . . . . . . . . (947) (884) (798)
Proceeds from disposals of property, plant and equipment . . . . . . . . . . . . . . . . . 15 5 6
Increase in investments. . . . . . . . . . . . . . . . . . . . . . . . . . . . . . . . . . . . . . . . . . . . . . . . . . . (1,220) (702) (380)
Decrease in investments. . . . . . . . . . . . . . . . . . . . . . . . . . . . . . . . . . . . . . . . . . . . . . . . . . 1,122 559 354
Cash paid for acquisitions, net of cash acquired . . . . . . . . . . . . . . . . . . . . . . . . . . . (1,133) (438) (973)
Proceeds from sales of businesses, net of fees paid . . . . . . . . . . . . . . . . . . . . . . . 3 21 1,156
Other.................................................................... 201 11 24
Net cash used for investing activities . . . . . . . . . . . . . . . . . . . . . . . . . . . (1,959) (1,428) (611)
Cash flows from financing activities:
Net increase (decrease) in commercial paper . . . . . . . . . . . . . . . . . . . . . . . . . . . . . . 899 (199) 300
Net increase (decrease) in short-term borrowings . . . . . . . . . . . . . . . . . . . . . . . . . . 31 22 (2)
Payment of debt assumed with acquisitions. . . . . . . . . . . . . . . . . . . . . . . . . . . . . . . . — — (33)
Proceeds from issuance of common stock . . . . . . . . . . . . . . . . . . . . . . . . . . . . . . . . . 447 342 304
Proceeds from issuance of long-term debt . . . . . . . . . . . . . . . . . . . . . . . . . . . . . . . . . 1,063 102 1,390
Payments of long-term debt. . . . . . . . . . . . . . . . . . . . . . . . . . . . . . . . . . . . . . . . . . . . . . . (607) (1) (939)
Excess tax benefits from share based payment arrangements . . . . . . . . . . . . . . 132 56 42
Repurchases of common stock. . . . . . . . . . . . . . . . . . . . . . . . . . . . . . . . . . . . . . . . . . . . (1,073) (317) (1,085)
Cash dividends paid . . . . . . . . . . . . . . . . . . . . . . . . . . . . . . . . . . . . . . . . . . . . . . . . . . . . . . (1,353) (1,211) (1,091)
Other.................................................................... 28 — —
Net cash used for financing activities . . . . . . . . . . . . . . . . . . . . . . . . . . . (433) (1,206) (1,114)
Effect of foreign exchange rate changes on cash and cash equivalents . . . . . . . . . (155) 53 (60)
Net increase in cash and cash equivalents. . . . . . . . . . . . . . . . . . . . . . . . . . . . . . . . . . . . . 1,788 936 1,048
Cash and cash equivalents at beginning of period. . . . . . . . . . . . . . . . . . . . . . . . . . . . . . 4,634 3,698 2,650
Cash and cash equivalents at end of period . . . . . . . . . . . . . . . . . . . . . . . . . . . . . . . . . . . $ 6,422 $ 4,634 $ 3,698
The Notes to Financial Statements are an integral part of this statement.
62