Honeywell 2013 Annual Report Download - page 42
Download and view the complete annual report
Please find page 42 of the 2013 Honeywell annual report below. You can navigate through the pages in the report by either clicking on the pages listed below, or by using the keyword search tool below to find specific information within the annual report.-
 1
1 -
2
-
3
-
4
-
5
-
6
-
7
-
8
-
9
-
10
-
11
-
12
-
13
-
14
-
15
-
16
-
17
-
18
-
19
-
20
-
21
-
22
-
23
-
24
-
25
-
26
-
27
-
28
-
29
-
30
-
31
-
 32
32 -
 33
33 -
 34
34 -
 35
35 -
 36
36 -
 37
37 -
 38
38 -
 39
39 -
 40
40 -
 41
41 -
 42
42 -
 43
43 -
 44
44 -
 45
45 -
 46
46 -
 47
47 -
 48
48 -
 49
49 -
 50
50 -
 51
51 -
 52
52 -
53
-
54
-
55
-
56
-
57
-
58
-
59
-
60
-
61
-
62
-
63
-
64
-
65
-
66
-
67
-
68
-
69
-
70
-
71
-
72
-
73
-
74
-
75
-
76
-
77
-
78
-
79
-
80
-
81
-
82
-
83
-
84
-
85
-
86
-
87
-
88
-
89
-
90
-
91
-
92
-
93
-
94
-
95
-
96
-
97
-
98
-
99
-
100
-
101
-
102
-
103
-
104
-
105
-
106
-
107
-
108
-
109
-
110
-
111
-
112
-
113
-
114
-
115
-
116
-
117
-
118
-
119
-
120
-
121
-
122
-
123
-
124
-
125
-
126
-
127
-
128
-
129
-
130
-
131
-
132
-
133
-
134
-
135
-
136
-
137
-
138
-
139
-
140
-
141
-
142
-
143
-
144
-
145
-
146
 |
 |

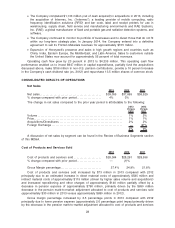
Consumables Solutions business in July 2008. This gain was partially offset by an increase in loss on
sale of non-strategic businesses and assets of $25 million, primarily due to a pre-tax loss of
approximately $28 million related to the pending divestiture of the Friction Materials business within our
Transportation Systems segment. See Note 2, Acquisitions and Divestitures for further details.
Other income decreased by $14 million in 2012 compared to 2011 due primarily to a $50 million
pre-tax gain related to the divestiture of the automotive on-board sensors products business within our
Automation and Control Solutions segment in the first quarter of 2011, partially offset by a loss of $29
million resulting from early redemption of debt in 2011 included within “Other, net” and the reduction of
approximately $6 million of acquisition related costs compared to 2011 included within “Other, net”.
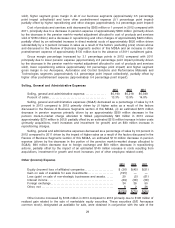
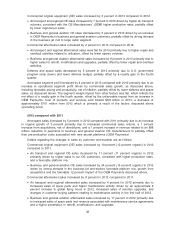
Interest and Other Financial Charges
2013 2012 2011
Interest and other financial charges . . . . . . . . . . . . . . . . . . . . . . . . . . . . . $327 $351 $376
% change compared with prior period. . . . . . . . . . . . . . . . . . . . . . . . . . . (7)% (7)%
Interest and other financial charges decreased by 7 percent in 2013 compared with 2012 primarily
due to lower borrowing costs, partially offset by higher average debt balances.
Interest and other financial charges decreased by 7 percent in 2012 compared with 2011 primarily
due to lower borrowing costs, partially offset by higher average debt balances.
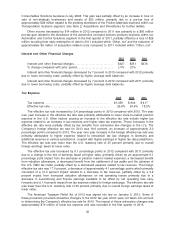
Tax Expense
2013 2012 2011
Tax expense . . . . . . . . . . . . . . . . . . . . . . . . . . . . . . . . . . . . . . . . . . . . . . . $1,450 $ 944 $ 417
Effective tax rate. . . . . . . . . . . . . . . . . . . . . . . . . . . . . . . . . . . . . . . . . . . . 26.8% 24.4% 18.3%
The effective tax rate increased by 2.4 percentage points in 2013 compared with 2012. The year
over year increase in the effective tax rate was primarily attributable to lower mark-to-market pension
expense in the U.S. Other factors causing an increase in the effective tax rate include higher tax
expense related to an increase in tax reserves and higher state tax expense. These increases in the
effective tax rate were partially offset by tax benefits from retroactive law changes in the U.S. The
Company’s foreign effective tax rate for 2013 was 19.0 percent, an increase of approximately 2.0
percentage points compared to 2012. The year over year increase in the foreign effective tax rate was
primarily attributable to higher expense related to retroactive tax law changes in Germany and
additional reserves in various jurisdictions, coupled with higher earnings in higher tax rate jurisdictions.
The effective tax rate was lower than the U.S. statutory rate of 35 percent primarily due to overall
foreign earnings taxed at lower rates.
The effective tax rate increased by 6.1 percentage points in 2012 compared with 2011 primarily
due to a change in the mix of earnings taxed at higher rates (primarily driven by an approximate 6.1
percentage point impact from the decrease in pension mark-to-market expense), a decreased benefit
from valuation allowances, a decreased benefit from the settlement of tax audits and the absence of
the U.S. R&D tax credit, partially offset by a decreased expense related to tax reserves. The foreign
effective tax rate was 17.0 percent, a decrease of approximately 4.1 percentage points which primarily
consisted of a 10.0 percent impact related to a decrease in tax reserves, partially offset by a 5.2
percent impact from increased valuation allowances on net operating losses primarily due to a
decrease in Luxembourg and France earnings available to be offset by net operating loss carry
forwards and a 1.4 percent impact from tax expense related to foreign exchange. The effective tax rate
was lower than the U.S. statutory rate of 35 percent primarily due to overall foreign earnings taxed at
lower rates.
The American Taxpayer Relief Act of 2012 was signed into law on January 2, 2013. Some of
these provisions provided retroactive changes to the 2012 tax year which were not taken into account
in determining the Company’s effective tax rate for 2012. The impact of these retroactive changes was
approximately $76 million of lower tax expense and was recorded in the first quarter of 2013.
30