Honeywell 2013 Annual Report Download - page 41
Download and view the complete annual report
Please find page 41 of the 2013 Honeywell annual report below. You can navigate through the pages in the report by either clicking on the pages listed below, or by using the keyword search tool below to find specific information within the annual report.-
 1
1 -
2
-
3
-
4
-
5
-
6
-
7
-
8
-
9
-
10
-
11
-
12
-
13
-
14
-
15
-
16
-
17
-
18
-
19
-
20
-
21
-
22
-
23
-
24
-
25
-
26
-
27
-
28
-
29
-
30
-
 31
31 -
 32
32 -
 33
33 -
 34
34 -
 35
35 -
 36
36 -
 37
37 -
 38
38 -
 39
39 -
 40
40 -
 41
41 -
 42
42 -
 43
43 -
 44
44 -
 45
45 -
 46
46 -
 47
47 -
 48
48 -
 49
49 -
 50
50 -
 51
51 -
52
-
53
-
54
-
55
-
56
-
57
-
58
-
59
-
60
-
61
-
62
-
63
-
64
-
65
-
66
-
67
-
68
-
69
-
70
-
71
-
72
-
73
-
74
-
75
-
76
-
77
-
78
-
79
-
80
-
81
-
82
-
83
-
84
-
85
-
86
-
87
-
88
-
89
-
90
-
91
-
92
-
93
-
94
-
95
-
96
-
97
-
98
-
99
-
100
-
101
-
102
-
103
-
104
-
105
-
106
-
107
-
108
-
109
-
110
-
111
-
112
-
113
-
114
-
115
-
116
-
117
-
118
-
119
-
120
-
121
-
122
-
123
-
124
-
125
-
126
-
127
-
128
-
129
-
130
-
131
-
132
-
133
-
134
-
135
-
136
-
137
-
138
-
139
-
140
-
141
-
142
-
143
-
144
-
145
-
146
 |
 |

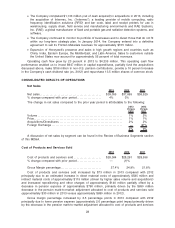
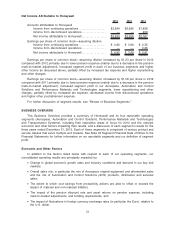
sold), higher segment gross margin in all of our business segments (approximately 0.5 percentage
point impact collectively) and lower other postretirement expense (0.1 percentage point impact)
partially offset by higher repositioning and other charges (approximately 0.4 percentage point impact)
Cost of products and services sold decreased by $265 million or 1 percent in 2012 compared with
2011, principally due to a decrease in pension expense of approximately $800 million (primarily driven
by the decrease in the pension mark-to-market adjustment allocated to cost of products and services
sold of $780 million) and a decrease in repositioning and other charges of approximately $220 million,
partially offset by an estimated increase in direct material costs of approximately $620 million driven
substantially by a 3 percent increase in sales as a result of the factors (excluding price) shown above
and discussed in the Review of Business Segments section of this MD&A and an increase in other
postretirement expense of approximately $135 million due to the absence of 2011 curtailment gains.
Gross margin percentage increased by 3.1 percentage points in 2012 compared with 2011
principally due to lower pension expense (approximately 2.2 percentage point impact primarily driven
by the decrease in the pension mark-to-market adjustment allocated to cost of products and services
sold), lower repositioning actions (approximately 0.6 percentage point impact) and higher segment
gross margin in our Aerospace, Automation and Control Solutions and Performance Materials and
Technologies segments (approximately 0.4 percentage point impact collectively), partially offset by
higher other postretirement expense (approximately 0.4 percentage point impact).
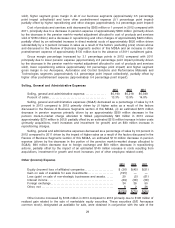
Selling, General and Administrative Expenses
2013 2012 2011
Selling, general and administrative expense. . . . . . . . . . . . . . . . $5,190 $5,218 $5,399
Percent of sales . . . . . . . . . . . . . . . . . . . . . . . . . . . . . . . . . . . . . . . . . . 13.3% 13.9% 14.8%
Selling, general and administrative expenses (SG&A) decreased as a percentage of sales by 0.6
percent in 2013 compared to 2012 primarily driven by (i) higher sales as a result of the factors
discussed in the Review of Business Segments section of this MD&A, (ii) an estimated $270 million
decrease in pension expense primarily driven by an approximately $250 million decrease in the
pension mark-to-market charge allocated to SG&A (approximately $20 million in 2013 versus
approximately $270 million in 2012) partially offset by an estimated $215 million increase in labor costs
(primarily acquisitions, merit increases and investment for growth) and an $80 million increase in
repositioning charges.
Selling, general and administrative expenses decreased as a percentage of sales by 0.9 percent in
2012 compared to 2011 driven by the impact of higher sales as a result of the factors discussed in the
Review of Business Segments section of this MD&A, an estimated $110 million decrease in pension
expense (driven by the decrease in the portion of the pension mark-to-market charge allocated to
SG&A), $90 million decrease due to foreign exchange and $80 million decrease in repositioning
actions, partially offset by the impact of an estimated $140 million increase in costs resulting from
acquisitions, investment for growth and merit increases (net of other employee related costs).
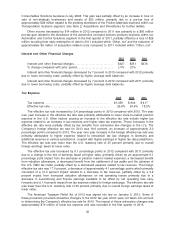
Other (Income) Expense
2013 2012 2011
Equity (income) loss of affiliated companies . . . . . . . . . . . . . . . . . . . . . $ (36) $(45) $(51)
Gain on sale of available for sale investments . . . . . . . . . . . . . . . . . . . (195) — —
Loss (gain) on sale of non-strategic businesses and assets . . . . . . 20 (5) (61)
Interest income . . . . . . . . . . . . . . . . . . . . . . . . . . . . . . . . . . . . . . . . . . . . . . . . (69) (58) (58)
Foreign exchange . . . . . . . . . . . . . . . . . . . . . . . . . . . . . . . . . . . . . . . . . . . . . . 34 36 50
Other, net . . . . . . . . . . . . . . . . . . . . . . . . . . . . . . . . . . . . . . . . . . . . . . . . . . . . . 8 2 36
$(238) $(70) $(84)
Other income increased by $168 million in 2013 compared to 2012 primarily due to $195 million of
realized gain related to the sale of marketable equity securities. These securities (B/E Aerospace
common stock), designated as available for sale, were obtained in conjunction with the sale of the
29