Honeywell 2013 Annual Report Download - page 4
Download and view the complete annual report
Please find page 4 of the 2013 Honeywell annual report below. You can navigate through the pages in the report by either clicking on the pages listed below, or by using the keyword search tool below to find specific information within the annual report.-
 1
1 -
 2
2 -
 3
3 -
 4
4 -
 5
5 -
 6
6 -
 7
7 -
 8
8 -
 9
9 -
 10
10 -
 11
11 -
 12
12 -
 13
13 -
 14
14 -
 15
15 -
16
-
17
-
18
-
19
-
20
-
21
-
22
-
23
-
24
-
25
-
26
-
27
-
28
-
29
-
30
-
31
-
32
-
33
-
34
-
35
-
36
-
37
-
38
-
39
-
40
-
41
-
42
-
43
-
44
-
45
-
46
-
47
-
48
-
49
-
50
-
51
-
52
-
53
-
54
-
55
-
56
-
57
-
58
-
59
-
60
-
61
-
62
-
63
-
64
-
65
-
66
-
67
-
68
-
69
-
70
-
71
-
72
-
73
-
74
-
75
-
76
-
77
-
78
-
79
-
80
-
81
-
82
-
83
-
84
-
85
-
86
-
87
-
88
-
89
-
90
-
91
-
92
-
93
-
94
-
95
-
96
-
97
-
98
-
99
-
100
-
101
-
102
-
103
-
104
-
105
-
106
-
107
-
108
-
109
-
110
-
111
-
112
-
113
-
114
-
115
-
116
-
117
-
118
-
119
-
120
-
121
-
122
-
123
-
124
-
125
-
126
-
127
-
128
-
129
-
130
-
131
-
132
-
133
-
134
-
135
-
136
-
137
-
138
-
139
-
140
-
141
-
142
-
143
-
144
-
145
-
146
 |
 |

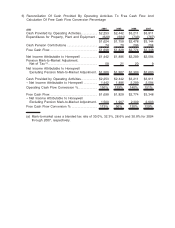
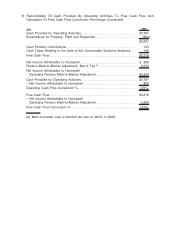
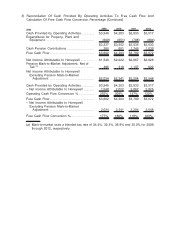
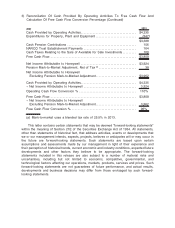
Our first priority is to continue driving superior cash flow by having high quality earnings.
That is, to have a high free cash flow conversion rate** (Free Cash Flow** divided by Net
Income*). In this decade we have averaged about 122% free cash flow conversion** meaning
very high-quality earnings.
The next priority is to ensure we invest in our businesses. We have to keep seed
planting. That’s particularly noteworthy now as we invest more heavily in Performance
Materials and Technologies (PMT) for new production capacity to support orders we’ve
already won. That’s a very nice position to be in where plants are basically full the day they
are completed. We’ll spend an additional $300 million of CAPEX in 2014 and about the same
amount again in 2015 largely driven by PMT plant projects. These are high IRR (Internal Rate
of Return) projects and a great use of shareowner funds to drive future performance in cash
and earnings.
The next priority is to pay a strong competitive dividend that we can be reasonably
confident will never be cut. Importantly, shareowners should have reasonable confidence that
the dividend will continue to grow in the future as we perform. Over the last 10 years we have
increased our dividend per share 140% from $0.75 to $1.80 per annum.
I used to say that after CAPEX and dividends, there were two other potential uses for
cash…share repurchases and acquisitions. Now I would add a third and that is to let cash
build a bit. When it comes to share repurchases, we want to do enough on an ongoing basis
to keep share count flat. Beyond that, we want to be opportunistic so we’re buying at the right
time. Studies estimate that nearly two out of three companies in the S&P 500 repurchase at
the wrong time. I’d say the 2007 big repurchase we did wasn’t one of my better decisions.
While we repurchased at an average price of $54 and today it’s about $90 (so it wasn’t that
bad), it sure would have felt better to have that $4 billion in the middle of the recession when
the stock price dropped to $23.23. Our repurchase strategy is to do enough on an ongoing
basis to hold share count flat (dollar cost averaging if you will) and be opportunistic for bigger
amounts when we can be confident we will be in the one third of companies that get the
timing right.
Letting cash build a bit will also let us be opportunistic to do more smart acquisitions,
something we do very well and now have a lot of credibility given our performance. We
continue to adhere to a rigorous, disciplined process that results in not overpaying, great
execution, and terrific results for shareowners. We have four major steps…identification,
valuation, due diligence, and integration. We developed this process internally and it works.
That adherence to discipline begins with me. For any deal over $50 million I personally
conduct the integration review pre-close, at 30-60-90 days, and quarterly thereafter for at
least a year to ensure we are performing as we said we would. We also never allow sales
synergies to be included in a valuation model. We do achieve good sales synergies and they
are a nice return upside, but I don’t want anyone counting on them. The process works.
The problem with good acquisitions is that the timing is unpredictable. I can’t say with
confidence how much we’ll be able to spend in any year. I’ve likened it to being in a retail
store where from 10AM to 2PM no one comes in and at 2:07PM, six people walk in at the
same time. We have to be ready when the time comes to take advantage of the opportunity.
* Proforma, excludes pension mark-to-market adjustment
** Free cash flow (cash flow from operations less capital expenditures) and free cash flow conversion prior to any cash pension
contributions, NARCO Trust establishment payments and cash taxes relating to the sale of available for sale investments. 2008
free cash flow excludes cash taxes related to the sale of the Consumable Solutions business.