Honeywell 2013 Annual Report Download - page 125
Download and view the complete annual report
Please find page 125 of the 2013 Honeywell annual report below. You can navigate through the pages in the report by either clicking on the pages listed below, or by using the keyword search tool below to find specific information within the annual report.-
 1
1 -
2
-
3
-
4
-
5
-
6
-
7
-
8
-
9
-
10
-
11
-
12
-
13
-
14
-
15
-
16
-
17
-
18
-
19
-
20
-
21
-
22
-
23
-
24
-
25
-
26
-
27
-
28
-
29
-
30
-
31
-
32
-
33
-
34
-
35
-
36
-
37
-
38
-
39
-
40
-
41
-
42
-
43
-
44
-
45
-
46
-
47
-
48
-
49
-
50
-
51
-
52
-
53
-
54
-
55
-
56
-
57
-
58
-
59
-
60
-
61
-
62
-
63
-
64
-
65
-
66
-
67
-
68
-
69
-
70
-
71
-
72
-
73
-
74
-
75
-
76
-
77
-
78
-
79
-
80
-
81
-
82
-
83
-
84
-
85
-
86
-
87
-
88
-
89
-
90
-
91
-
92
-
93
-
94
-
95
-
96
-
97
-
98
-
99
-
100
-
101
-
102
-
103
-
104
-
105
-
106
-
107
-
108
-
109
-
110
-
111
-
112
-
113
-
114
-
 115
115 -
 116
116 -
 117
117 -
 118
118 -
 119
119 -
 120
120 -
 121
121 -
 122
122 -
 123
123 -
 124
124 -
 125
125 -
 126
126 -
 127
127 -
 128
128 -
 129
129 -
 130
130 -
 131
131 -
 132
132 -
 133
133 -
 134
134 -
 135
135 -
136
-
137
-
138
-
139
-
140
-
141
-
142
-
143
-
144
-
145
-
146
 |
 |

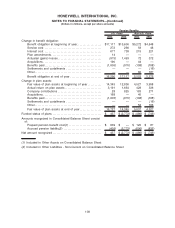
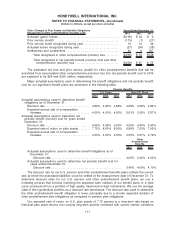
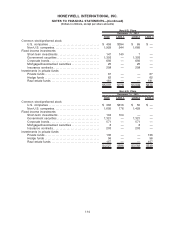
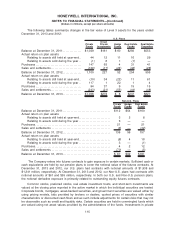
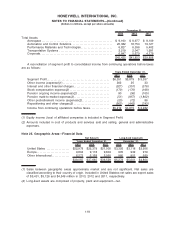
The fair values of both our U.S. and non-U.S. pension plans assets at December 31, 2013 and
2012 by asset category are as follows:
Total Level 1 Level 2 Level 3
December 31, 2013
U.S. Plans
Common stock/preferred stock:
Honeywell common stock. . . . . . . . . . . . . . . . . . . . . . . . . $ 1,697 $ 1,697 $ — $ —
U.S. large cap stocks . . . . . . . . . . . . . . . . . . . . . . . . . . . . 4,147 4,107 40 —
U.S. mid cap stocks. . . . . . . . . . . . . . . . . . . . . . . . . . . . . . 757 752 5 —
U.S. small cap stocks . . . . . . . . . . . . . . . . . . . . . . . . . . . . 215 210 5 —
International stocks. . . . . . . . . . . . . . . . . . . . . . . . . . . . . . . 2,685 2,503 182 —
Real estate investment trusts . . . . . . . . . . . . . . . . . . . . . 90 90 — —
Fixed income investments:
Short term investments . . . . . . . . . . . . . . . . . . . . . . . . . . . 956 955 1 —
Government securities. . . . . . . . . . . . . . . . . . . . . . . . . . . . 266 — 266 —
Corporate bonds . . . . . . . . . . . . . . . . . . . . . . . . . . . . . . . . . 2,931 — 2,931 —
Mortgage/Asset-backed securities . . . . . . . . . . . . . . . . . 770 — 770 —
Insurance contracts . . . . . . . . . . . . . . . . . . . . . . . . . . . . . . 7 — 7 —
Investments in private funds:
Private funds . . . . . . . . . . . . . . . . . . . . . . . . . . . . . . . . . . . . 1,058 — — 1,058
Hedge funds . . . . . . . . . . . . . . . . . . . . . . . . . . . . . . . . . . . . . 6 — — 6
Real estate funds . . . . . . . . . . . . . . . . . . . . . . . . . . . . . . . . 237 — — 237
Direct investments:
Direct private investments . . . . . . . . . . . . . . . . . . . . . . . . 278 — — 278
Real estate properties . . . . . . . . . . . . . . . . . . . . . . . . . . . . 627 — — 627
$16,727 $10,314 $4,207 $2,206
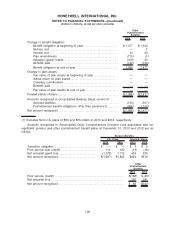
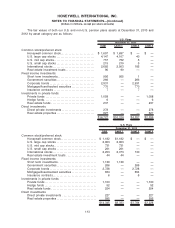
Total Level 1 Level 2 Level 3
December 31, 2012
U.S. Plans
Common stock/preferred stock:
Honeywell common stock . . . . . . . . . . . . . . . . . . . . . . . . . . $ 1,182 $1,182 $ — $ —
U.S. large cap stocks. . . . . . . . . . . . . . . . . . . . . . . . . . . . . . 2,903 2,903 — —
U.S. mid cap stocks . . . . . . . . . . . . . . . . . . . . . . . . . . . . . . . 731 731 — —
U.S. small cap stocks . . . . . . . . . . . . . . . . . . . . . . . . . . . . . 261 261 — —
International stocks . . . . . . . . . . . . . . . . . . . . . . . . . . . . . . . . 2,203 2,073 130 —
Real estate investment trusts . . . . . . . . . . . . . . . . . . . . . . 44 44 — —
Fixed income investments:
Short term investments . . . . . . . . . . . . . . . . . . . . . . . . . . . . 1,139 1,139 — —
Government securities . . . . . . . . . . . . . . . . . . . . . . . . . . . . . 266 — 266 —
Corporate bonds . . . . . . . . . . . . . . . . . . . . . . . . . . . . . . . . . . 2,728 — 2,728 —
Mortgage/Asset-backed securities . . . . . . . . . . . . . . . . . . 654 — 654 —
Insurance contracts. . . . . . . . . . . . . . . . . . . . . . . . . . . . . . . . 6 — 6 —
Investments in private funds:
Private funds. . . . . . . . . . . . . . . . . . . . . . . . . . . . . . . . . . . . . . 1,100 — — 1,100
Hedge funds . . . . . . . . . . . . . . . . . . . . . . . . . . . . . . . . . . . . . . 52 — — 52
Real estate funds . . . . . . . . . . . . . . . . . . . . . . . . . . . . . . . . . 254 — — 254
Direct investments:
Direct private investments . . . . . . . . . . . . . . . . . . . . . . . . . 227 — — 227
Real estate properties . . . . . . . . . . . . . . . . . . . . . . . . . . . . . 595 — — 595
$14,345 $8,333 $3,784 $2,228
113
HONEYWELL INTERNATIONAL INC.
NOTES TO FINANCIAL STATEMENTS—(Continued)
(Dollars in millions, except per share amounts)