Honeywell 2013 Annual Report Download - page 53
Download and view the complete annual report
Please find page 53 of the 2013 Honeywell annual report below. You can navigate through the pages in the report by either clicking on the pages listed below, or by using the keyword search tool below to find specific information within the annual report.-
 1
1 -
2
-
3
-
4
-
5
-
6
-
7
-
8
-
9
-
10
-
11
-
12
-
13
-
14
-
15
-
16
-
17
-
18
-
19
-
20
-
21
-
22
-
23
-
24
-
25
-
26
-
27
-
28
-
29
-
30
-
31
-
32
-
33
-
34
-
35
-
36
-
37
-
38
-
39
-
40
-
41
-
42
-
 43
43 -
 44
44 -
 45
45 -
 46
46 -
 47
47 -
 48
48 -
 49
49 -
 50
50 -
 51
51 -
 52
52 -
 53
53 -
 54
54 -
 55
55 -
 56
56 -
 57
57 -
 58
58 -
 59
59 -
 60
60 -
 61
61 -
 62
62 -
 63
63 -
64
-
65
-
66
-
67
-
68
-
69
-
70
-
71
-
72
-
73
-
74
-
75
-
76
-
77
-
78
-
79
-
80
-
81
-
82
-
83
-
84
-
85
-
86
-
87
-
88
-
89
-
90
-
91
-
92
-
93
-
94
-
95
-
96
-
97
-
98
-
99
-
100
-
101
-
102
-
103
-
104
-
105
-
106
-
107
-
108
-
109
-
110
-
111
-
112
-
113
-
114
-
115
-
116
-
117
-
118
-
119
-
120
-
121
-
122
-
123
-
124
-
125
-
126
-
127
-
128
-
129
-
130
-
131
-
132
-
133
-
134
-
135
-
136
-
137
-
138
-
139
-
140
-
141
-
142
-
143
-
144
-
145
-
146
 |
 |
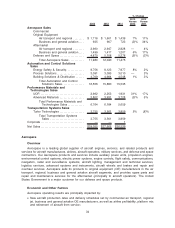
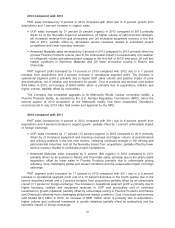
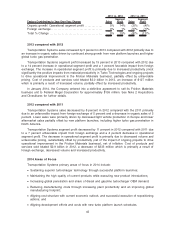
2013 compared with 2012
PMT sales increased by 9 percent in 2013 compared with 2012 due to 8 percent growth from
acquisitions and 1 percent increase in organic sales.
•UOP sales increased by 31 percent (9 percent organic) in 2013 compared to 2012 primarily
driven by (i) the favorable impact of acquisitions, (ii) higher volume of petrochemical catalysts,
(iii) increased revenue from gas processing and (iv) increased equipment revenue in the first
half of 2013, partially offset by decreased service revenues related to scheduled project
completions and lower licensing revenues.
•Advanced Materials sales decreased by 3 percent in 2013 compared to 2012 primarily driven by
(i) lower Flourine Products volume (due to the unfavorable impact of unseasonably cool weather
on refrigerant volume and planned plant outages in the first half of 2013) and price, (ii) soft end
market conditions in Electronic Materials and (iii) lower production volume in Resins and
Chemicals.
PMT segment profit increased by 10 percent in 2013 compared with 2012 due to a 7 percent
increase from acquisitions and 3 percent increase in operational segment profit. The increase in
operational segment profit is primarily due to higher UOP sales volume and positive impact of price
and productivity, net of inflation and investment for growth. Cost of products and services sold totaled
$4.9 billion in 2013, an increase of $408 million which is primarily due to acquisitions, inflation and
higher volume, partially offset by productivity.
The Company has completed upgrades to its Metropolis Works nuclear conversion facility, a
Fluorine Products facility, as required by the U.S. Nuclear Regulatory Commission (NRC). Since the
second quarter of 2012 production at the Metropolis facility had been suspended. Operations
recommenced in July 2013 after final review and approval by the NRC.
2012 compared with 2011
PMT sales increased by 9 percent in 2012 compared with 2011 due to 6 percent growth from
acquisitions and 4 percent increase in organic growth, partially offset by 1 percent unfavorable impact
of foreign exchange.
•UOP sales increased by 17 percent (12 percent organic) in 2012 compared to 2011 primarily
driven by (i) increased equipment and licensing revenues and higher volume of petrochemical
and refining catalysts in the first nine months, reflecting continued strength in the refining and
petrochemical industries, and (ii) the favorable impact from acquisitions, partially offset by lower
service revenue related to scheduled project completions.
•Advanced Materials sales increased by 5 percent (flat organic) in 2012 compared to 2011
primarily driven by an increase in Resins and Chemicals sales, primarily due to the phenol plant
acquisition; offset by lower sales in Fluorine Products primarily due to unfavorable pricing
reflecting more challenging global end market conditions and the unfavorable impact of foreign
exchange.
PMT segment profit increased by 11 percent in 2012 compared with 2011 due to a 9 percent
increase in operational segment profit (net of a 10 percent decrease in the fourth quarter due to the
factors described below) and a 3 percent increase from acquisitions partially offset by an unfavorable
impact of 1 percent in foreign exchange. The increase in operational segment profit is primarily due to
higher licensing, catalyst and equipment revenues in UOP and productivity (net of continued
investment in growth initiatives) partially offset by unfavorable pricing in Fluorine Products and Resins
and Chemicals reflecting more challenging global end market conditions. Cost of products and services
sold totaled $4.5 billion in 2012, an increase of $381 million which is primarily due to acquisitions,
higher volume and continued investment in growth initiatives partially offset by productivity and the
favorable impact of foreign exchange.
41