Honeywell 2013 Annual Report Download - page 123
Download and view the complete annual report
Please find page 123 of the 2013 Honeywell annual report below. You can navigate through the pages in the report by either clicking on the pages listed below, or by using the keyword search tool below to find specific information within the annual report.-
 1
1 -
2
-
3
-
4
-
5
-
6
-
7
-
8
-
9
-
10
-
11
-
12
-
13
-
14
-
15
-
16
-
17
-
18
-
19
-
20
-
21
-
22
-
23
-
24
-
25
-
26
-
27
-
28
-
29
-
30
-
31
-
32
-
33
-
34
-
35
-
36
-
37
-
38
-
39
-
40
-
41
-
42
-
43
-
44
-
45
-
46
-
47
-
48
-
49
-
50
-
51
-
52
-
53
-
54
-
55
-
56
-
57
-
58
-
59
-
60
-
61
-
62
-
63
-
64
-
65
-
66
-
67
-
68
-
69
-
70
-
71
-
72
-
73
-
74
-
75
-
76
-
77
-
78
-
79
-
80
-
81
-
82
-
83
-
84
-
85
-
86
-
87
-
88
-
89
-
90
-
91
-
92
-
93
-
94
-
95
-
96
-
97
-
98
-
99
-
100
-
101
-
102
-
103
-
104
-
105
-
106
-
107
-
108
-
109
-
110
-
111
-
112
-
 113
113 -
 114
114 -
 115
115 -
 116
116 -
 117
117 -
 118
118 -
 119
119 -
 120
120 -
 121
121 -
 122
122 -
 123
123 -
 124
124 -
 125
125 -
 126
126 -
 127
127 -
 128
128 -
 129
129 -
 130
130 -
 131
131 -
 132
132 -
 133
133 -
134
-
135
-
136
-
137
-
138
-
139
-
140
-
141
-
142
-
143
-
144
-
145
-
146
 |
 |

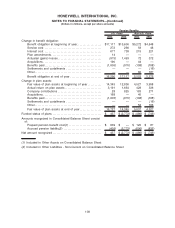
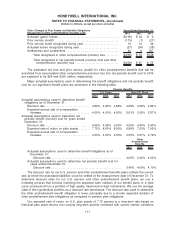
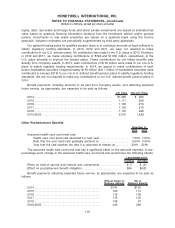
Other Changes in Plan Assets and Benefits Obligations
Recognized in Other Comprehensive (Income) Loss 2013 2012 2011
Years Ended December 31,
Actuarial (gains) losses . . . . . . . . . . . . . . . . . . . . . . . . . . . . . . . . . . . . . . . . . . . . $(108) $ 34 $ 6
Prior service (credit) . . . . . . . . . . . . . . . . . . . . . . . . . . . . . . . . . . . . . . . . . . . . . . . (175) (1) (21)
Prior service credit recognized during year . . . . . . . . . . . . . . . . . . . . . . . . . . 13 14 34
Actuarial losses recognized during year . . . . . . . . . . . . . . . . . . . . . . . . . . . . . (27) (34) (38)
Settlements and curtailments . . . . . . . . . . . . . . . . . . . . . . . . . . . . . . . . . . . . . . . 42 6 167
Total recognized in other comprehensive (income) loss. . . . . . . . . . $(255) $ 19 $148
Total recognized in net periodic benefit (income) cost and other
comprehensive (income) loss . . . . . . . . . . . . . . . . . . . . . . . . . . . . . . . . $(239) $ 87 $ 55
The estimated net loss and prior service (credit) for other postretirement benefits that will be
amortized from accumulated other comprehensive (income) loss into net periodic benefit cost in 2014
are expected to be $24 and $(20) million, respectively.
Major actuarial assumptions used in determining the benefit obligations and net periodic benefit
cost for our significant benefit plans are presented in the following table.
2013 2012 2011 2013 2012 2011
U.S. Plans Non-U.S. Plans
Pension Benefits
Actuarial assumptions used to determine benefit
obligations as of December 31:
Discount rate . . . . . . . . . . . . . . . . . . . . . . . . . . . . . . . . 4.89% 4.06% 4.89% 4.29% 4.29% 4.84%
Expected annual rate of compensation
increase . . . . . . . . . . . . . . . . . . . . . . . . . . . . . . . . . . . 4.50% 4.50% 4.50% 2.81% 3.55% 3.67%
Actuarial assumptions used to determine net
periodic benefit (income) cost for years ended
December 31:
Discount rate . . . . . . . . . . . . . . . . . . . . . . . . . . . . . . . . 4.06% 4.89% 5.25% 4.29% 4.84% 5.40%
Expected rate of return on plan assets. . . . . . . . 7.75% 8.00% 8.00% 6.99% 7.03% 7.06%
Expected annual rate of compensation
increase . . . . . . . . . . . . . . . . . . . . . . . . . . . . . . . . . . . 4.50% 4.50% 4.50% 3.55% 3.67% 3.79%
2013 2012 2011
Other
Postretirement
Benefits
Actuarial assumptions used to determine benefit obligations as of
December 31:
Discount rate . . . . . . . . . . . . . . . . . . . . . . . . . . . . . . . . . . . . . . . . . . . . . . . . . . . . 4.05% 3.40% 4.00%
Actuarial assumptions used to determine net periodic benefit cost for
years ended December 31:
Discount rate . . . . . . . . . . . . . . . . . . . . . . . . . . . . . . . . . . . . . . . . . . . . . . . . . . . . 3.40% 4.00% 4.70%
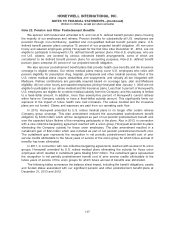
The discount rate for our U.S. pension and other postretirement benefits plans reflects the current
rate at which the associated liabilities could be settled at the measurement date of December 31. To
determine discount rates for our U.S. pension and other postretirement benefit plans, we use a
modeling process that involves matching the expected cash outflows of our benefit plans to a yield
curve constructed from a portfolio of high quality, fixed-income debt instruments. We use the average
yield of this hypothetical portfolio as a discount rate benchmark. The discount rate used to determine
the other postretirement benefit obligation is lower principally due to a shorter expected duration of
other postretirement plan obligations as compared to pension plan obligations.
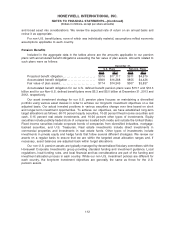
Our expected rate of return on U.S. plan assets of 7.75 percent is a long-term rate based on
historical plan asset returns over varying long-term periods combined with current market conditions
111
HONEYWELL INTERNATIONAL INC.
NOTES TO FINANCIAL STATEMENTS—(Continued)
(Dollars in millions, except per share amounts)