Honeywell 2008 Annual Report Download - page 95
Download and view the complete annual report
Please find page 95 of the 2008 Honeywell annual report below. You can navigate through the pages in the report by either clicking on the pages listed below, or by using the keyword search tool below to find specific information within the annual report.-
 1
1 -
2
-
3
-
4
-
5
-
6
-
7
-
8
-
9
-
10
-
11
-
12
-
13
-
14
-
15
-
16
-
17
-
18
-
19
-
20
-
21
-
22
-
23
-
24
-
25
-
26
-
27
-
28
-
29
-
30
-
31
-
32
-
33
-
34
-
35
-
36
-
37
-
38
-
39
-
40
-
41
-
42
-
43
-
44
-
45
-
46
-
47
-
48
-
49
-
50
-
51
-
52
-
53
-
54
-
55
-
56
-
57
-
58
-
59
-
60
-
61
-
62
-
63
-
64
-
65
-
66
-
67
-
68
-
69
-
70
-
71
-
72
-
73
-
74
-
75
-
76
-
77
-
78
-
79
-
80
-
81
-
82
-
83
-
84
-
 85
85 -
 86
86 -
 87
87 -
 88
88 -
 89
89 -
 90
90 -
 91
91 -
 92
92 -
 93
93 -
 94
94 -
 95
95 -
 96
96 -
 97
97 -
 98
98 -
 99
99 -
 100
100 -
 101
101 -
 102
102 -
 103
103 -
 104
104 -
 105
105 -
106
-
107
-
108
-
109
-
110
-
111
-
112
-
113
-
114
-
115
-
116
-
117
-
118
-
119
-
120
-
121
-
122
-
123
-
124
-
125
-
126
-
127
-
128
-
129
-
130
-
131
-
132
-
133
-
134
-
135
-
136
-
137
-
138
-
139
-
140
-
141
-
142
-
143
-
144
-
145
-
146
-
147
-
148
-
149
-
150
-
151
-
152
-
153
-
154
-
155
-
156
-
157
-
158
-
159
-
160
-
161
-
162
-
163
-
164
-
165
-
166
-
167
-
168
-
169
-
170
-
171
-
172
-
173
-
174
-
175
-
176
-
177
-
178
-
179
-
180
-
181
-
182
-
183
-
184
-
185
-
186
-
187
-
188
-
189
-
190
-
191
-
192
-
193
-
194
-
195
-
196
-
197
-
198
-
199
-
200
-
201
-
202
-
203
-
204
-
205
-
206
-
207
-
208
-
209
-
210
-
211
-
212
-
213
-
214
-
215
-
216
-
217
-
218
-
219
-
220
-
221
-
222
-
223
-
224
-
225
-
226
-
227
-
228
-
229
-
230
-
231
-
232
-
233
-
234
-
235
-
236
-
237
-
238
-
239
-
240
-
241
-
242
-
243
-
244
-
245
-
246
-
247
-
248
-
249
-
250
-
251
-
252
-
253
-
254
-
255
-
256
-
257
-
258
-
259
-
260
-
261
-
262
-
263
-
264
-
265
-
266
-
267
-
268
-
269
-
270
-
271
-
272
-
273
-
274
-
275
-
276
-
277
-
278
-
279
-
280
-
281
-
282
-
283
-
284
-
285
-
286
-
287
-
288
-
289
-
290
-
291
-
292
-
293
-
294
-
295
-
296
-
297
-
298
-
299
-
300
-
301
-
302
-
303
-
304
-
305
-
306
-
307
-
308
-
309
-
310
-
311
-
312
-
313
-
314
-
315
-
316
-
317
-
318
-
319
-
320
-
321
-
322
-
323
-
324
-
325
-
326
-
327
-
328
-
329
-
330
-
331
-
332
-
333
-
334
-
335
-
336
-
337
-
338
-
339
-
340
-
341
-
342
-
343
-
344
-
345
-
346
-
347
-
348
-
349
-
350
-
351
-
352
 |
 |

HONEYWELL INTERNATIONAL INC.
NOTES TO FINANCIAL STATEMENTS—(Continued)
(Dollars in millions, except per share amounts)
Years Ended December 31,
2008 2007 2006
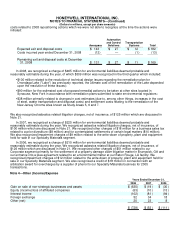
The U.S. statutory federal income tax rate is reconciled to our
effective income tax rate as follows:
Statutory U.S. federal income tax rate 35.0% 35.0% 35.0%
Taxes on foreign earnings below U.S. tax rate (1) (6.4) (4.6) (4.0)
State income taxes (1) 1.8 .9 1.7
Tax benefits on export sales — — (1.9)
Domestic Manufacturing Deduction (.7) (.8) (.3)
ESOP Dividend Tax Benefit (.5) (.5) (.7)
Tax credits (1.0) (.6) (.7)
Audit Settlements (1.5) (2.9) (2.9)
All other items—net (.2) (.1) (.5)
26.5% 26.4% 25.7%
(1) Net of changes in valuation allowance.
The effective tax rate increased by 0.1 of a percentage point in 2008 compared with 2007 due principally to a
higher overall state effective tax rate and a decreased impact from the settlement of audits, partially offset by a
decrease in the foreign effective tax rate.
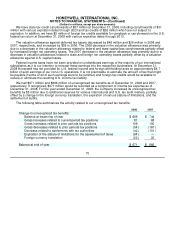
Deferred tax assets (liabilities)
Deferred income taxes represent the future tax effects of transactions which are reported in different periods
for tax and financial reporting purposes. The tax effects of temporary differences and tax carryforwards which
give rise to future income tax benefits and payables are as follows:
December 31,
2008 2007
Property, plant and equipment basis differences $ (605) $ (563)
Postretirement benefits other than pensions and post employment benefits 876 770
Investment and other asset basis differences (598) (376)
Other accrued items 2,477 1,025
Net operating and capital losses 740 783
Tax credits 87 33
Undistributed earnings of subsidiaries (40) (40)
All other items—net (175) (21)
2,762 1,611
Valuation allowance (445) (490)
$ 2,317 $ 1,121