Honeywell 2008 Annual Report Download - page 46
Download and view the complete annual report
Please find page 46 of the 2008 Honeywell annual report below. You can navigate through the pages in the report by either clicking on the pages listed below, or by using the keyword search tool below to find specific information within the annual report.-
 1
1 -
2
-
3
-
4
-
5
-
6
-
7
-
8
-
9
-
10
-
11
-
12
-
13
-
14
-
15
-
16
-
17
-
18
-
19
-
20
-
21
-
22
-
23
-
24
-
25
-
26
-
27
-
28
-
29
-
30
-
31
-
32
-
33
-
34
-
35
-
 36
36 -
 37
37 -
 38
38 -
 39
39 -
 40
40 -
 41
41 -
 42
42 -
 43
43 -
 44
44 -
 45
45 -
 46
46 -
 47
47 -
 48
48 -
 49
49 -
 50
50 -
 51
51 -
 52
52 -
 53
53 -
 54
54 -
 55
55 -
 56
56 -
57
-
58
-
59
-
60
-
61
-
62
-
63
-
64
-
65
-
66
-
67
-
68
-
69
-
70
-
71
-
72
-
73
-
74
-
75
-
76
-
77
-
78
-
79
-
80
-
81
-
82
-
83
-
84
-
85
-
86
-
87
-
88
-
89
-
90
-
91
-
92
-
93
-
94
-
95
-
96
-
97
-
98
-
99
-
100
-
101
-
102
-
103
-
104
-
105
-
106
-
107
-
108
-
109
-
110
-
111
-
112
-
113
-
114
-
115
-
116
-
117
-
118
-
119
-
120
-
121
-
122
-
123
-
124
-
125
-
126
-
127
-
128
-
129
-
130
-
131
-
132
-
133
-
134
-
135
-
136
-
137
-
138
-
139
-
140
-
141
-
142
-
143
-
144
-
145
-
146
-
147
-
148
-
149
-
150
-
151
-
152
-
153
-
154
-
155
-
156
-
157
-
158
-
159
-
160
-
161
-
162
-
163
-
164
-
165
-
166
-
167
-
168
-
169
-
170
-
171
-
172
-
173
-
174
-
175
-
176
-
177
-
178
-
179
-
180
-
181
-
182
-
183
-
184
-
185
-
186
-
187
-
188
-
189
-
190
-
191
-
192
-
193
-
194
-
195
-
196
-
197
-
198
-
199
-
200
-
201
-
202
-
203
-
204
-
205
-
206
-
207
-
208
-
209
-
210
-
211
-
212
-
213
-
214
-
215
-
216
-
217
-
218
-
219
-
220
-
221
-
222
-
223
-
224
-
225
-
226
-
227
-
228
-
229
-
230
-
231
-
232
-
233
-
234
-
235
-
236
-
237
-
238
-
239
-
240
-
241
-
242
-
243
-
244
-
245
-
246
-
247
-
248
-
249
-
250
-
251
-
252
-
253
-
254
-
255
-
256
-
257
-
258
-
259
-
260
-
261
-
262
-
263
-
264
-
265
-
266
-
267
-
268
-
269
-
270
-
271
-
272
-
273
-
274
-
275
-
276
-
277
-
278
-
279
-
280
-
281
-
282
-
283
-
284
-
285
-
286
-
287
-
288
-
289
-
290
-
291
-
292
-
293
-
294
-
295
-
296
-
297
-
298
-
299
-
300
-
301
-
302
-
303
-
304
-
305
-
306
-
307
-
308
-
309
-
310
-
311
-
312
-
313
-
314
-
315
-
316
-
317
-
318
-
319
-
320
-
321
-
322
-
323
-
324
-
325
-
326
-
327
-
328
-
329
-
330
-
331
-
332
-
333
-
334
-
335
-
336
-
337
-
338
-
339
-
340
-
341
-
342
-
343
-
344
-
345
-
346
-
347
-
348
-
349
-
350
-
351
-
352
 |
 |

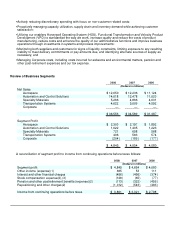
• Sustaining strong brand recognition through our brand and channel management;
•
Centralization and standardization of global software development capabilities;
•
Continuing to identify, execute and integrate acquisitions in or adjacent to the markets which we serve;
•
Continuing to establish emerging markets presence and capability;
•
Process solutions for asset management and energy efficiency; and
•
Continuing to invest in new product development.
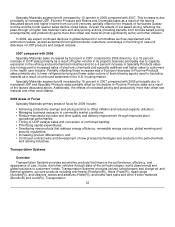
Specialty Materials
Overview
Specialty Materials develops and manufactures high-purity, high-quality and high-performance chemicals
and materials for applications in the refining, petrochemical, automotive, healthcare, agricultural, packaging,
refrigeration, appliance, housing, semiconductor, wax and adhesives segments. Specialty Materials also provides
process technology, products and services for the petroleum refining, petrochemical and other industries.
Specialty Materials' product portfolio includes fluorocarbons, caprolactam, ammonium sulfate for fertilizer,
specialty films, advanced fibers, customized research chemicals and intermediates, electronic materials and
chemicals, catalysts, and adsorbents.
Economic and Other Factors
Specialty Materials operating results are principally driven by:
• Level of capital spending and capacity and utilization rates in refining and petrochemical end markets;
•
Degree of pricing volatility in raw materials such as benzene (the key component in phenol), fluorspar,
natural gas, ethylene and sulfur;
•
Impact of environmental and energy efficiency regulations;
•
Extent of change in order rates from global semiconductor customers;
•
Global demand for non-ozone depleting Hydro fluorocarbons (HFC's);
•
Condition of the US residential housing industry; and
•
Global demand for commodities such as caprolactam and ammonium sulfate.
Results of Operations
2008 2007 2006
(Dollars in millions)
Net sales $ 5,266 $ 4,866 $ 4,631
% change compared with prior year 8% 5%
Segment profit $ 721 $ 658 $ 568
% change compared with prior year 10% 16%
2008 compared with 2007
Specialty Materials sales increased by 8 percent in 2008 compared to 2007 primarily driven by (i) increased
pricing reflecting the pass-through of higher raw material costs and other pricing actions (including benefits from
formula based pricing arrangements), most significantly in Resins and Chemicals and Fluorine Products, and (ii)
an 8 percent increase in UOP sales as a result of higher volume sales in its products and projects businesses.
Full year 2008 sales growth was partially offset by a 12 percent sales decline in revenue during the fourth
quarter, primarily in our Resins and Chemicals business due to sharp declines in global demand for commodities
such as caprolactam and ammonium sulfate.
31