Honeywell 2008 Annual Report Download - page 22
Download and view the complete annual report
Please find page 22 of the 2008 Honeywell annual report below. You can navigate through the pages in the report by either clicking on the pages listed below, or by using the keyword search tool below to find specific information within the annual report.-
 1
1 -
2
-
3
-
4
-
5
-
6
-
7
-
8
-
9
-
10
-
11
-
 12
12 -
 13
13 -
 14
14 -
 15
15 -
 16
16 -
 17
17 -
 18
18 -
 19
19 -
 20
20 -
 21
21 -
 22
22 -
 23
23 -
 24
24 -
 25
25 -
 26
26 -
 27
27 -
 28
28 -
 29
29 -
 30
30 -
 31
31 -
 32
32 -
33
-
34
-
35
-
36
-
37
-
38
-
39
-
40
-
41
-
42
-
43
-
44
-
45
-
46
-
47
-
48
-
49
-
50
-
51
-
52
-
53
-
54
-
55
-
56
-
57
-
58
-
59
-
60
-
61
-
62
-
63
-
64
-
65
-
66
-
67
-
68
-
69
-
70
-
71
-
72
-
73
-
74
-
75
-
76
-
77
-
78
-
79
-
80
-
81
-
82
-
83
-
84
-
85
-
86
-
87
-
88
-
89
-
90
-
91
-
92
-
93
-
94
-
95
-
96
-
97
-
98
-
99
-
100
-
101
-
102
-
103
-
104
-
105
-
106
-
107
-
108
-
109
-
110
-
111
-
112
-
113
-
114
-
115
-
116
-
117
-
118
-
119
-
120
-
121
-
122
-
123
-
124
-
125
-
126
-
127
-
128
-
129
-
130
-
131
-
132
-
133
-
134
-
135
-
136
-
137
-
138
-
139
-
140
-
141
-
142
-
143
-
144
-
145
-
146
-
147
-
148
-
149
-
150
-
151
-
152
-
153
-
154
-
155
-
156
-
157
-
158
-
159
-
160
-
161
-
162
-
163
-
164
-
165
-
166
-
167
-
168
-
169
-
170
-
171
-
172
-
173
-
174
-
175
-
176
-
177
-
178
-
179
-
180
-
181
-
182
-
183
-
184
-
185
-
186
-
187
-
188
-
189
-
190
-
191
-
192
-
193
-
194
-
195
-
196
-
197
-
198
-
199
-
200
-
201
-
202
-
203
-
204
-
205
-
206
-
207
-
208
-
209
-
210
-
211
-
212
-
213
-
214
-
215
-
216
-
217
-
218
-
219
-
220
-
221
-
222
-
223
-
224
-
225
-
226
-
227
-
228
-
229
-
230
-
231
-
232
-
233
-
234
-
235
-
236
-
237
-
238
-
239
-
240
-
241
-
242
-
243
-
244
-
245
-
246
-
247
-
248
-
249
-
250
-
251
-
252
-
253
-
254
-
255
-
256
-
257
-
258
-
259
-
260
-
261
-
262
-
263
-
264
-
265
-
266
-
267
-
268
-
269
-
270
-
271
-
272
-
273
-
274
-
275
-
276
-
277
-
278
-
279
-
280
-
281
-
282
-
283
-
284
-
285
-
286
-
287
-
288
-
289
-
290
-
291
-
292
-
293
-
294
-
295
-
296
-
297
-
298
-
299
-
300
-
301
-
302
-
303
-
304
-
305
-
306
-
307
-
308
-
309
-
310
-
311
-
312
-
313
-
314
-
315
-
316
-
317
-
318
-
319
-
320
-
321
-
322
-
323
-
324
-
325
-
326
-
327
-
328
-
329
-
330
-
331
-
332
-
333
-
334
-
335
-
336
-
337
-
338
-
339
-
340
-
341
-
342
-
343
-
344
-
345
-
346
-
347
-
348
-
349
-
350
-
351
-
352
 |
 |

or grow as we currently anticipate. The failure of our technologies or products to gain market acceptance due to
more attractive offerings by our competitors could significantly reduce our revenues and adversely affect our
competitive standing and prospects.
Protecting our intellectual property is critical to our innovation efforts. We own or are licensed under a large
number of U.S. and non-U.S. patents and patent applications, trademarks and copyrights. Our intellectual
property rights may be challenged, invalidated or infringed upon by third parties or we may be unable to maintain,
renew or enter into new licenses of third party proprietary intellectual property on commercially reasonable terms.
In some non-U.S. countries, laws affecting intellectual property are uncertain in their application, which can affect
the scope or enforceability of our patents and other intellectual property rights. Any of these events or factors
could diminish or cause us to lose the competitive advantages associated with our intellectual property, subject
us to judgments, penalties and significant litigation costs, and/or temporarily or permanently disrupt our sales and
marketing of the affected products or services.
An increasing percentage of our sales and operations is in non-U.S. jurisdictions and is subject to the
economic, political, regulatory and other risks of international operations.
Our international operations, including U.S. exports, comprise a growing proportion of our operating results.
Our strategy calls for increasing sales to and operations in overseas markets, including developing markets such
as Mexico, China, India and the Middle East. In 2008, 49 percent of our total sales (including products
manufactured in the U.S. and in international locations) were outside of the U.S. including 29 percent in Europe
and 10 percent in Asia. Risks related to international operations include exchange control regulations, wage and
price controls, employment regulations, foreign investment laws, import, export and other trade restrictions (such
as embargoes and trade restrictions), changes in regulations regarding transactions with state-owned
enterprises, nationalization of private enterprises, government instability, our ability to hire and maintain qualified
staff in these regions and maintaining the safety of our employees. The cost of compliance with increasingly
complex and often conflicting regulations worldwide can also impair our flexibility in modifying product, marketing,
pricing or other strategies for growing our businesses, as well as our ability to improve productivity and maintain
acceptable operating margins.
As we continue to grow our businesses internationally, our operating results could be increasingly affected by
the relative strength of the European and Asian economies and the impact of exchange rate fluctuations. We do
have a policy to reduce the risk of volatility through hedging activities, but such activities bear a financial cost and
may not always be available to us and may not be successful in eliminating such volatility.
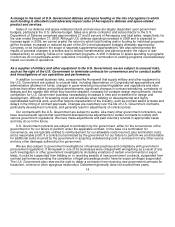
We may be required to recognize impairment charges for our long-lived assets or available for sale
investments.
At December 31, 2008, the net carrying value of long-lived assets (property, plant and equipment, goodwill
and other intangible assets) and available for sale securities totaled approximately $17.4 billion and $0.1 billion,
respectively. In accordance with generally accepted accounting principles, we periodically assess these assets to
determine if they are impaired. Significant negative industry or economic trends, disruptions to our business,
unexpected significant changes or planned changes in use of the assets, divestitures and market capitalization
declines may result in impairments to goodwill and other long-lived assets. An other than temporary decline in the
market value of our available for sale securities may also result in an impairment charge. Future impairment
charges could significantly affect our results of operations in the periods recognized. Impairment charges would
also reduce our consolidated shareowners' equity and increase our debt-to-total-capitalization ratio, which could
negatively impact our credit rating and access to the public debt and equity markets.
13