Honeywell 2008 Annual Report Download - page 139
Download and view the complete annual report
Please find page 139 of the 2008 Honeywell annual report below. You can navigate through the pages in the report by either clicking on the pages listed below, or by using the keyword search tool below to find specific information within the annual report.-
 1
1 -
2
-
3
-
4
-
5
-
6
-
7
-
8
-
9
-
10
-
11
-
12
-
13
-
14
-
15
-
16
-
17
-
18
-
19
-
20
-
21
-
22
-
23
-
24
-
25
-
26
-
27
-
28
-
29
-
30
-
31
-
32
-
33
-
34
-
35
-
36
-
37
-
38
-
39
-
40
-
41
-
42
-
43
-
44
-
45
-
46
-
47
-
48
-
49
-
50
-
51
-
52
-
53
-
54
-
55
-
56
-
57
-
58
-
59
-
60
-
61
-
62
-
63
-
64
-
65
-
66
-
67
-
68
-
69
-
70
-
71
-
72
-
73
-
74
-
75
-
76
-
77
-
78
-
79
-
80
-
81
-
82
-
83
-
84
-
85
-
86
-
87
-
88
-
89
-
90
-
91
-
92
-
93
-
94
-
95
-
96
-
97
-
98
-
99
-
100
-
101
-
102
-
103
-
104
-
105
-
106
-
107
-
108
-
109
-
110
-
111
-
112
-
113
-
114
-
115
-
116
-
117
-
118
-
119
-
120
-
121
-
122
-
123
-
124
-
125
-
126
-
127
-
128
-
 129
129 -
 130
130 -
 131
131 -
 132
132 -
 133
133 -
 134
134 -
 135
135 -
 136
136 -
 137
137 -
 138
138 -
 139
139 -
 140
140 -
 141
141 -
 142
142 -
 143
143 -
 144
144 -
 145
145 -
 146
146 -
 147
147 -
 148
148 -
 149
149 -
150
-
151
-
152
-
153
-
154
-
155
-
156
-
157
-
158
-
159
-
160
-
161
-
162
-
163
-
164
-
165
-
166
-
167
-
168
-
169
-
170
-
171
-
172
-
173
-
174
-
175
-
176
-
177
-
178
-
179
-
180
-
181
-
182
-
183
-
184
-
185
-
186
-
187
-
188
-
189
-
190
-
191
-
192
-
193
-
194
-
195
-
196
-
197
-
198
-
199
-
200
-
201
-
202
-
203
-
204
-
205
-
206
-
207
-
208
-
209
-
210
-
211
-
212
-
213
-
214
-
215
-
216
-
217
-
218
-
219
-
220
-
221
-
222
-
223
-
224
-
225
-
226
-
227
-
228
-
229
-
230
-
231
-
232
-
233
-
234
-
235
-
236
-
237
-
238
-
239
-
240
-
241
-
242
-
243
-
244
-
245
-
246
-
247
-
248
-
249
-
250
-
251
-
252
-
253
-
254
-
255
-
256
-
257
-
258
-
259
-
260
-
261
-
262
-
263
-
264
-
265
-
266
-
267
-
268
-
269
-
270
-
271
-
272
-
273
-
274
-
275
-
276
-
277
-
278
-
279
-
280
-
281
-
282
-
283
-
284
-
285
-
286
-
287
-
288
-
289
-
290
-
291
-
292
-
293
-
294
-
295
-
296
-
297
-
298
-
299
-
300
-
301
-
302
-
303
-
304
-
305
-
306
-
307
-
308
-
309
-
310
-
311
-
312
-
313
-
314
-
315
-
316
-
317
-
318
-
319
-
320
-
321
-
322
-
323
-
324
-
325
-
326
-
327
-
328
-
329
-
330
-
331
-
332
-
333
-
334
-
335
-
336
-
337
-
338
-
339
-
340
-
341
-
342
-
343
-
344
-
345
-
346
-
347
-
348
-
349
-
350
-
351
-
352
 |
 |

HONEYWELL INTERNATIONAL INC.
NOTES TO FINANCIAL STATEMENTS—(Continued)
(Dollars in millions, except per share amounts)
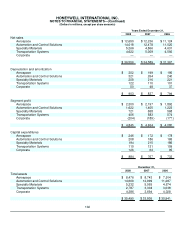
Note 23—Segment Financial Data
We globally manage our business operations through four reportable operating segments serving customers
worldwide with aerospace products and services, control, sensing and security technologies for buildings, homes
and industry, automotive products and chemicals. Segment information is consistent with how management
reviews the businesses, makes investing and resource allocation decisions and assesses operating
performance. Our four reportable segments are as follows:
• Aerospace is organized by customer end-market (Air Transport and Regional, Business and General
Aviation and Defense and Space) and provides products and services which include auxiliary power units;
propulsion engines; environmental control systems; engine controls; repair and overhaul services;
hardware; logistics; electric power systems; flight safety, communications, navigation, radar and surveillance
systems; aircraft lighting; management and technical services; advanced systems and instruments; and
aircraft wheels and brakes.
•
Automation and Control Solutions includes Products (controls for heating, cooling, indoor air quality,
ventilation, humidification and home automation; advanced software applications for home/building control
and optimization; sensors, switches, control systems and instruments for measuring pressure, air flow,
temperature and electrical current; security, fire and gas detection; personal protection equipment; access
control; video surveillance; and remote patient monitoring systems); Building Solutions (installs, maintains
and upgrades systems that keep buildings safe, comfortable and productive); and Process Solutions
(provides a full range of automation and control solutions for industrial plants, offering advanced software
and automation systems that integrate, control and monitor complex processes in many types of industrial
settings).
•
Specialty Materials includes fluorocarbons, specialty films, advanced fibers, customized research chemicals
and intermediates, electronic materials and chemicals, and catalysts and adsorbents.
•
Transportation Systems includes Honeywell Turbo Technologies (turbochargers and charge-air and thermal
systems); and the Consumer Products Group (car care products including anti-freeze, filters, spark plugs,
and cleaners, waxes and additives); and Friction Materials (brake hard parts and other friction materials).
The accounting policies of the segments are the same as those described in Note 1. Honeywell's senior
management evaluates segment performance based on segment profit. Segment profit is measured as business
unit income (loss) before taxes excluding general corporate unallocated expense, other income (expense),
interest and other financial charges, pension and other postretirement benefits (expense), stock compensation
expense, repositioning and other charges and accounting changes. Beginning January 1, 2008, consistent with
changes made to the measure of segment performance utilized by senior management, segment profit has been
adjusted to exclude expense associated with restricted stock units ("RSU") and to include equity income/(loss) of
affiliated companies. Stock compensation expense, including RSU expense, totaled $112 and $106 million for
the years ended December 31, 2007 and 2006, respectively. Equity income/(loss) of affiliated companies,
included in other income (expense), totaled $10 million and $13 million for the years ended December 31, 2007
and 2006, respectively. Both of these changes were applied on a prospective basis beginning January 1, 2008
and are not material to the following reportable segment data:
101