Honeywell 2008 Annual Report Download - page 35
Download and view the complete annual report
Please find page 35 of the 2008 Honeywell annual report below. You can navigate through the pages in the report by either clicking on the pages listed below, or by using the keyword search tool below to find specific information within the annual report.-
 1
1 -
2
-
3
-
4
-
5
-
6
-
7
-
8
-
9
-
10
-
11
-
12
-
13
-
14
-
15
-
16
-
17
-
18
-
19
-
20
-
21
-
22
-
23
-
24
-
 25
25 -
 26
26 -
 27
27 -
 28
28 -
 29
29 -
 30
30 -
 31
31 -
 32
32 -
 33
33 -
 34
34 -
 35
35 -
 36
36 -
 37
37 -
 38
38 -
 39
39 -
 40
40 -
 41
41 -
 42
42 -
 43
43 -
 44
44 -
 45
45 -
46
-
47
-
48
-
49
-
50
-
51
-
52
-
53
-
54
-
55
-
56
-
57
-
58
-
59
-
60
-
61
-
62
-
63
-
64
-
65
-
66
-
67
-
68
-
69
-
70
-
71
-
72
-
73
-
74
-
75
-
76
-
77
-
78
-
79
-
80
-
81
-
82
-
83
-
84
-
85
-
86
-
87
-
88
-
89
-
90
-
91
-
92
-
93
-
94
-
95
-
96
-
97
-
98
-
99
-
100
-
101
-
102
-
103
-
104
-
105
-
106
-
107
-
108
-
109
-
110
-
111
-
112
-
113
-
114
-
115
-
116
-
117
-
118
-
119
-
120
-
121
-
122
-
123
-
124
-
125
-
126
-
127
-
128
-
129
-
130
-
131
-
132
-
133
-
134
-
135
-
136
-
137
-
138
-
139
-
140
-
141
-
142
-
143
-
144
-
145
-
146
-
147
-
148
-
149
-
150
-
151
-
152
-
153
-
154
-
155
-
156
-
157
-
158
-
159
-
160
-
161
-
162
-
163
-
164
-
165
-
166
-
167
-
168
-
169
-
170
-
171
-
172
-
173
-
174
-
175
-
176
-
177
-
178
-
179
-
180
-
181
-
182
-
183
-
184
-
185
-
186
-
187
-
188
-
189
-
190
-
191
-
192
-
193
-
194
-
195
-
196
-
197
-
198
-
199
-
200
-
201
-
202
-
203
-
204
-
205
-
206
-
207
-
208
-
209
-
210
-
211
-
212
-
213
-
214
-
215
-
216
-
217
-
218
-
219
-
220
-
221
-
222
-
223
-
224
-
225
-
226
-
227
-
228
-
229
-
230
-
231
-
232
-
233
-
234
-
235
-
236
-
237
-
238
-
239
-
240
-
241
-
242
-
243
-
244
-
245
-
246
-
247
-
248
-
249
-
250
-
251
-
252
-
253
-
254
-
255
-
256
-
257
-
258
-
259
-
260
-
261
-
262
-
263
-
264
-
265
-
266
-
267
-
268
-
269
-
270
-
271
-
272
-
273
-
274
-
275
-
276
-
277
-
278
-
279
-
280
-
281
-
282
-
283
-
284
-
285
-
286
-
287
-
288
-
289
-
290
-
291
-
292
-
293
-
294
-
295
-
296
-
297
-
298
-
299
-
300
-
301
-
302
-
303
-
304
-
305
-
306
-
307
-
308
-
309
-
310
-
311
-
312
-
313
-
314
-
315
-
316
-
317
-
318
-
319
-
320
-
321
-
322
-
323
-
324
-
325
-
326
-
327
-
328
-
329
-
330
-
331
-
332
-
333
-
334
-
335
-
336
-
337
-
338
-
339
-
340
-
341
-
342
-
343
-
344
-
345
-
346
-
347
-
348
-
349
-
350
-
351
-
352
 |
 |

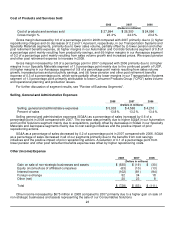
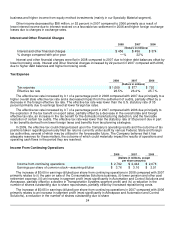
repurchases, and lower pension and other post retirement expense, partially offset by increased repositioning
costs.
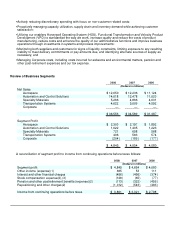
For further discussion of segment results, see "Review of Business Segments".
Income From Discontinued Operations
Income from discontinued operations of $5 million, or $0.01 earnings per share (diluted) in 2006 relates to
the operating results of the Indalex business which was sold in February 2006 to Sun Capital Partners, Inc.
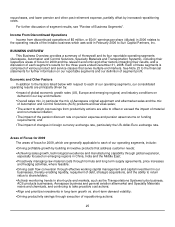
BUSINESS OVERVIEW
This Business Overview provides a summary of Honeywell and its four reportable operating segments
(Aerospace, Automation and Control Solutions, Specialty Materials and Transportation Systems), including their
respective areas of focus for 2009 and the relevant economic and other factors impacting their results, and a
discussion of each segment's results for the three years ended December 31, 2008. Each of these segments is
comprised of various product and service classes that serve multiple end markets. See Note 23 to the financial
statements for further information on our reportable segments and our definition of segment profit.
Economic and Other Factors
In addition to the factors listed below with respect to each of our operating segments, our consolidated
operating results are principally driven by:
• Impact of global economic growth rates (US, Europe and emerging regions) and industry conditions on
demand in our key end markets;
•
Overall sales mix, in particular the mix of Aerospace original equipment and aftermarket sales and the mix
of Automation and Control Solutions (ACS) products and services sales;
•
The extent to which cost savings from productivity actions are able to offset or exceed the impact of material
and non-material inflation;
•
The impact of the pension discount rate on pension expense and pension asset returns on funding
requirements; and
•
The impact of changes in foreign currency exchange rate, particularly the US dollar-Euro exchange rate.
Areas of Focus for 2009
The areas of focus for 2009, which are generally applicable to each of our operating segments, include:
• Driving profitable growth by building innovative products that address customer needs;
•
Achieving sales growth, technological excellence and manufacturing capability through global expansion,
especially focused on emerging regions in China, India and the Middle East;
•
Proactively managing raw material costs through formula and long term supply agreements, price increases
and hedging activities, where feasible;
•
Driving cash flow conversion through effective working capital management and capital investment in our
businesses, thereby enabling liquidity, repayment of debt, strategic acquisitions, and the ability to return
value to shareholders;
•
Actively monitoring trends in short-cycle end markets, such as the Transportations Systems turbo business,
ACS products businesses, Aerospace business and general aviation aftermarket and Specialty Materials
resins and chemicals, and continuing to take proactive cost actions;
•
Align and prioritize investments in long-term growth vs. short-term demand volatility;
•
Driving productivity savings through execution of repositioning actions;
25