Honeywell 2008 Annual Report Download - page 105
Download and view the complete annual report
Please find page 105 of the 2008 Honeywell annual report below. You can navigate through the pages in the report by either clicking on the pages listed below, or by using the keyword search tool below to find specific information within the annual report.-
 1
1 -
2
-
3
-
4
-
5
-
6
-
7
-
8
-
9
-
10
-
11
-
12
-
13
-
14
-
15
-
16
-
17
-
18
-
19
-
20
-
21
-
22
-
23
-
24
-
25
-
26
-
27
-
28
-
29
-
30
-
31
-
32
-
33
-
34
-
35
-
36
-
37
-
38
-
39
-
40
-
41
-
42
-
43
-
44
-
45
-
46
-
47
-
48
-
49
-
50
-
51
-
52
-
53
-
54
-
55
-
56
-
57
-
58
-
59
-
60
-
61
-
62
-
63
-
64
-
65
-
66
-
67
-
68
-
69
-
70
-
71
-
72
-
73
-
74
-
75
-
76
-
77
-
78
-
79
-
80
-
81
-
82
-
83
-
84
-
85
-
86
-
87
-
88
-
89
-
90
-
91
-
92
-
93
-
94
-
 95
95 -
 96
96 -
 97
97 -
 98
98 -
 99
99 -
 100
100 -
 101
101 -
 102
102 -
 103
103 -
 104
104 -
 105
105 -
 106
106 -
 107
107 -
 108
108 -
 109
109 -
 110
110 -
 111
111 -
 112
112 -
 113
113 -
 114
114 -
 115
115 -
116
-
117
-
118
-
119
-
120
-
121
-
122
-
123
-
124
-
125
-
126
-
127
-
128
-
129
-
130
-
131
-
132
-
133
-
134
-
135
-
136
-
137
-
138
-
139
-
140
-
141
-
142
-
143
-
144
-
145
-
146
-
147
-
148
-
149
-
150
-
151
-
152
-
153
-
154
-
155
-
156
-
157
-
158
-
159
-
160
-
161
-
162
-
163
-
164
-
165
-
166
-
167
-
168
-
169
-
170
-
171
-
172
-
173
-
174
-
175
-
176
-
177
-
178
-
179
-
180
-
181
-
182
-
183
-
184
-
185
-
186
-
187
-
188
-
189
-
190
-
191
-
192
-
193
-
194
-
195
-
196
-
197
-
198
-
199
-
200
-
201
-
202
-
203
-
204
-
205
-
206
-
207
-
208
-
209
-
210
-
211
-
212
-
213
-
214
-
215
-
216
-
217
-
218
-
219
-
220
-
221
-
222
-
223
-
224
-
225
-
226
-
227
-
228
-
229
-
230
-
231
-
232
-
233
-
234
-
235
-
236
-
237
-
238
-
239
-
240
-
241
-
242
-
243
-
244
-
245
-
246
-
247
-
248
-
249
-
250
-
251
-
252
-
253
-
254
-
255
-
256
-
257
-
258
-
259
-
260
-
261
-
262
-
263
-
264
-
265
-
266
-
267
-
268
-
269
-
270
-
271
-
272
-
273
-
274
-
275
-
276
-
277
-
278
-
279
-
280
-
281
-
282
-
283
-
284
-
285
-
286
-
287
-
288
-
289
-
290
-
291
-
292
-
293
-
294
-
295
-
296
-
297
-
298
-
299
-
300
-
301
-
302
-
303
-
304
-
305
-
306
-
307
-
308
-
309
-
310
-
311
-
312
-
313
-
314
-
315
-
316
-
317
-
318
-
319
-
320
-
321
-
322
-
323
-
324
-
325
-
326
-
327
-
328
-
329
-
330
-
331
-
332
-
333
-
334
-
335
-
336
-
337
-
338
-
339
-
340
-
341
-
342
-
343
-
344
-
345
-
346
-
347
-
348
-
349
-
350
-
351
-
352
 |
 |

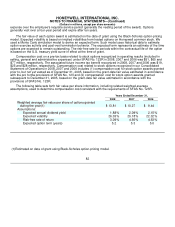
HONEYWELL INTERNATIONAL INC.
NOTES TO FINANCIAL STATEMENTS—(Continued)
(Dollars in millions, except per share amounts)
Note 14—Long-term Debt and Credit Agreements
December 31,
2008 2007
6.20% notes due 2008 $ — $ 200
71/8% notes due 2008 — 200
Floating rate notes due 2009 300 300
Floating rate notes due 2009 500 500
Zero coupon bonds and money multiplier notes,
13.0%—14.26%, due 2009 100 100
Floating rate notes due 2009-2011 193 220
7.50% notes due 2010 1,000 1,000
61/8% notes due 2011 500 500
5.625% notes due 2012 400 400
4.25% notes due 2013 600 —
5.40% notes due 2016 400 400
5.30% notes due 2017 400 400
5.30% notes due 2018 900 —
Industrial development bond obligations, floating rate
maturing at various dates through 2037 60 60
65/8% debentures due 2028 216 216
9.065% debentures due 2033 51 51
5.70% notes due 2036 550 550
5.70% notes due 2037 600 600
Other (including capitalized leases), 1.54%—11.24%,
maturing at various dates through 2020 118 140
6,888 5,837
Less—current portion (1,023) (418)
$ 5,865 $ 5,419
The schedule of principal payments on long-term debt is as follows:
At December 31,
2008
2009 1,023
2010 1,106
2011 536
2012 401
2013 605
Thereafter 3,217
6,888
Less—current portion (1,023)
$ 5,865
We maintain $3.8 billion of committed bank revolving credit facilities, including a $2.8 billion five year
revolving credit facility with a group of banks, arranged by Citigroup Global Markets Inc. and J.P.Morgan
Securities Inc. which is in place through mid-May 2012. This credit facility contains a $700 million sub- limit for
the issuance of letters of credit. The $2.8 billion credit facility is maintained for general corporate purposes,