Honeywell 2008 Annual Report Download - page 37
Download and view the complete annual report
Please find page 37 of the 2008 Honeywell annual report below. You can navigate through the pages in the report by either clicking on the pages listed below, or by using the keyword search tool below to find specific information within the annual report.-
 1
1 -
2
-
3
-
4
-
5
-
6
-
7
-
8
-
9
-
10
-
11
-
12
-
13
-
14
-
15
-
16
-
17
-
18
-
19
-
20
-
21
-
22
-
23
-
24
-
25
-
26
-
 27
27 -
 28
28 -
 29
29 -
 30
30 -
 31
31 -
 32
32 -
 33
33 -
 34
34 -
 35
35 -
 36
36 -
 37
37 -
 38
38 -
 39
39 -
 40
40 -
 41
41 -
 42
42 -
 43
43 -
 44
44 -
 45
45 -
 46
46 -
 47
47 -
48
-
49
-
50
-
51
-
52
-
53
-
54
-
55
-
56
-
57
-
58
-
59
-
60
-
61
-
62
-
63
-
64
-
65
-
66
-
67
-
68
-
69
-
70
-
71
-
72
-
73
-
74
-
75
-
76
-
77
-
78
-
79
-
80
-
81
-
82
-
83
-
84
-
85
-
86
-
87
-
88
-
89
-
90
-
91
-
92
-
93
-
94
-
95
-
96
-
97
-
98
-
99
-
100
-
101
-
102
-
103
-
104
-
105
-
106
-
107
-
108
-
109
-
110
-
111
-
112
-
113
-
114
-
115
-
116
-
117
-
118
-
119
-
120
-
121
-
122
-
123
-
124
-
125
-
126
-
127
-
128
-
129
-
130
-
131
-
132
-
133
-
134
-
135
-
136
-
137
-
138
-
139
-
140
-
141
-
142
-
143
-
144
-
145
-
146
-
147
-
148
-
149
-
150
-
151
-
152
-
153
-
154
-
155
-
156
-
157
-
158
-
159
-
160
-
161
-
162
-
163
-
164
-
165
-
166
-
167
-
168
-
169
-
170
-
171
-
172
-
173
-
174
-
175
-
176
-
177
-
178
-
179
-
180
-
181
-
182
-
183
-
184
-
185
-
186
-
187
-
188
-
189
-
190
-
191
-
192
-
193
-
194
-
195
-
196
-
197
-
198
-
199
-
200
-
201
-
202
-
203
-
204
-
205
-
206
-
207
-
208
-
209
-
210
-
211
-
212
-
213
-
214
-
215
-
216
-
217
-
218
-
219
-
220
-
221
-
222
-
223
-
224
-
225
-
226
-
227
-
228
-
229
-
230
-
231
-
232
-
233
-
234
-
235
-
236
-
237
-
238
-
239
-
240
-
241
-
242
-
243
-
244
-
245
-
246
-
247
-
248
-
249
-
250
-
251
-
252
-
253
-
254
-
255
-
256
-
257
-
258
-
259
-
260
-
261
-
262
-
263
-
264
-
265
-
266
-
267
-
268
-
269
-
270
-
271
-
272
-
273
-
274
-
275
-
276
-
277
-
278
-
279
-
280
-
281
-
282
-
283
-
284
-
285
-
286
-
287
-
288
-
289
-
290
-
291
-
292
-
293
-
294
-
295
-
296
-
297
-
298
-
299
-
300
-
301
-
302
-
303
-
304
-
305
-
306
-
307
-
308
-
309
-
310
-
311
-
312
-
313
-
314
-
315
-
316
-
317
-
318
-
319
-
320
-
321
-
322
-
323
-
324
-
325
-
326
-
327
-
328
-
329
-
330
-
331
-
332
-
333
-
334
-
335
-
336
-
337
-
338
-
339
-
340
-
341
-
342
-
343
-
344
-
345
-
346
-
347
-
348
-
349
-
350
-
351
-
352
 |
 |

•
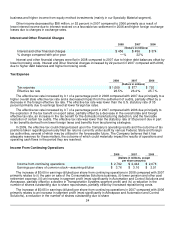
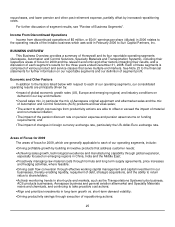
Actively reducing discretionary spending with focus on non-customer related costs;
•
Proactively managing capacity utilization, supply chain and inventory demand while achieving customer
satisfaction;
•
Utilizing our enablers Honeywell Operating System (HOS), Functional Transformation and Velocity Product
Development (VPD) to standardize the way we work, increase quality and reduce the costs of product
manufacturing, reduce costs and enhance the quality of our administrative functions and improve business
operations through investments in systems and process improvements;
•
Monitoring both suppliers and customers for signs of liquidity constraints, limiting exposure to any resulting
inability to meet delivery commitments or pay amounts due, and identifying alternate sources of supply as
necessary; and
•
Managing Corporate costs, including costs incurred for asbestos and environmental matters, pension and
other post-retirement expenses and our tax expense.
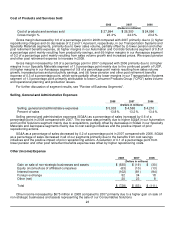
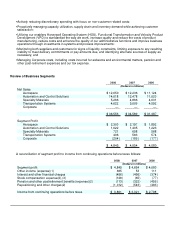
Review of Business Segments
2008 2007 2006
(Dollars in millions)
Net Sales
Aerospace $ 12,650 $ 12,236 $ 11,124
Automation and Control Solutions 14,018 12,478 11,020
Specialty Materials 5,266 4,866 4,631
Transportation Systems 4,622 5,009 4,592
Corporate — — —
$ 36,556 $ 34,589 $ 31,367
Segment Profit
Aerospace $ 2,300 $ 2,197 $ 1,892
Automation and Control Solutions 1,622 1,405 1,223
Specialty Materials 721 658 568
Transportation Systems 406 583 574
Corporate (204) (189) (177)
$ 4,845 $ 4,654 $ 4,080
A reconciliation of segment profit to income from continuing operations before taxes follows:
2008 2007 2006
(Dollars in millions)
Segment profit $ 4,845 $ 4,654 $ 4,080
Other income (expense)(1) 665 53 111
Interest and other financial charges (456) (456) (374)
Stock compensation expense(2),(3) (128) (65) (77)
Pension and other postretirement benefits (expense)(2) (113) (322) (459)
Repositioning and other charges(2) (1,012) (543) (483)
Income from continuing operations before taxes $ 3,801 $ 3,321 $ 2,798