Honeywell 2008 Annual Report Download - page 117
Download and view the complete annual report
Please find page 117 of the 2008 Honeywell annual report below. You can navigate through the pages in the report by either clicking on the pages listed below, or by using the keyword search tool below to find specific information within the annual report.-
 1
1 -
2
-
3
-
4
-
5
-
6
-
7
-
8
-
9
-
10
-
11
-
12
-
13
-
14
-
15
-
16
-
17
-
18
-
19
-
20
-
21
-
22
-
23
-
24
-
25
-
26
-
27
-
28
-
29
-
30
-
31
-
32
-
33
-
34
-
35
-
36
-
37
-
38
-
39
-
40
-
41
-
42
-
43
-
44
-
45
-
46
-
47
-
48
-
49
-
50
-
51
-
52
-
53
-
54
-
55
-
56
-
57
-
58
-
59
-
60
-
61
-
62
-
63
-
64
-
65
-
66
-
67
-
68
-
69
-
70
-
71
-
72
-
73
-
74
-
75
-
76
-
77
-
78
-
79
-
80
-
81
-
82
-
83
-
84
-
85
-
86
-
87
-
88
-
89
-
90
-
91
-
92
-
93
-
94
-
95
-
96
-
97
-
98
-
99
-
100
-
101
-
102
-
103
-
104
-
105
-
106
-
 107
107 -
 108
108 -
 109
109 -
 110
110 -
 111
111 -
 112
112 -
 113
113 -
 114
114 -
 115
115 -
 116
116 -
 117
117 -
 118
118 -
 119
119 -
 120
120 -
 121
121 -
 122
122 -
 123
123 -
 124
124 -
 125
125 -
 126
126 -
 127
127 -
128
-
129
-
130
-
131
-
132
-
133
-
134
-
135
-
136
-
137
-
138
-
139
-
140
-
141
-
142
-
143
-
144
-
145
-
146
-
147
-
148
-
149
-
150
-
151
-
152
-
153
-
154
-
155
-
156
-
157
-
158
-
159
-
160
-
161
-
162
-
163
-
164
-
165
-
166
-
167
-
168
-
169
-
170
-
171
-
172
-
173
-
174
-
175
-
176
-
177
-
178
-
179
-
180
-
181
-
182
-
183
-
184
-
185
-
186
-
187
-
188
-
189
-
190
-
191
-
192
-
193
-
194
-
195
-
196
-
197
-
198
-
199
-
200
-
201
-
202
-
203
-
204
-
205
-
206
-
207
-
208
-
209
-
210
-
211
-
212
-
213
-
214
-
215
-
216
-
217
-
218
-
219
-
220
-
221
-
222
-
223
-
224
-
225
-
226
-
227
-
228
-
229
-
230
-
231
-
232
-
233
-
234
-
235
-
236
-
237
-
238
-
239
-
240
-
241
-
242
-
243
-
244
-
245
-
246
-
247
-
248
-
249
-
250
-
251
-
252
-
253
-
254
-
255
-
256
-
257
-
258
-
259
-
260
-
261
-
262
-
263
-
264
-
265
-
266
-
267
-
268
-
269
-
270
-
271
-
272
-
273
-
274
-
275
-
276
-
277
-
278
-
279
-
280
-
281
-
282
-
283
-
284
-
285
-
286
-
287
-
288
-
289
-
290
-
291
-
292
-
293
-
294
-
295
-
296
-
297
-
298
-
299
-
300
-
301
-
302
-
303
-
304
-
305
-
306
-
307
-
308
-
309
-
310
-
311
-
312
-
313
-
314
-
315
-
316
-
317
-
318
-
319
-
320
-
321
-
322
-
323
-
324
-
325
-
326
-
327
-
328
-
329
-
330
-
331
-
332
-
333
-
334
-
335
-
336
-
337
-
338
-
339
-
340
-
341
-
342
-
343
-
344
-
345
-
346
-
347
-
348
-
349
-
350
-
351
-
352
 |
 |

HONEYWELL INTERNATIONAL INC.
NOTES TO FINANCIAL STATEMENTS—(Continued)
(Dollars in millions, except per share amounts)
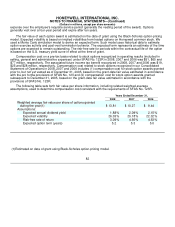
Restricted Stock Units—Restricted stock unit (RSU) awards entitle the holder to receive one share of
common stock for each unit when the units vest. RSU's are issued to certain key employees at fair market value
at the date of grant as compensation. RSUs typically become fully vested over periods ranging from three to
seven years and are payable in Honeywell common stock upon vesting.
The following table summarizes information about RSU activity for the three years ended December 31,
2008:
Number of
Restricted
Stock Units
Weighted
Average
Grant Date
Fair Value
Per
Share
Non-vested at December 31, 2005 3,965,531 $ 32.97
Granted 1,948,650 $ 39.11
Vested (759,015) $ 30.04
Forfeited (403,167) $ 34.25
Non-vested at December 31, 2006 4,751,999 $ 35.85
Granted 1,980,850 $ 54.47
Vested (372,105) $ 32.48
Forfeited (503,747) $ 37.93
Non-vested at December 31, 2007 5,856,997 $ 42.18
Granted 2,087,934 $ 54.56
Vested (694,660) $ 35.82
Forfeited (424,554) $ 41.94
Non-vested at December 31, 2008 6,825,717 $ 46.63
As of December 31, 2008, there was approximately $179 million of total unrecognized compensation cost
related to non-vested RSUs granted under our stock plans which is expected to be recognized over a weighted-
average period of 2.0 years. Compensation expense related to RSUs was $77, $47 and $29 million in 2008,
2007 and 2006, respectively.
Non-Employee Directors' Plan—Under the Directors' Plan each new director receives a one-time grant of
3,000 restricted stock units that will vest on the fifth anniversary of continuous Board service.
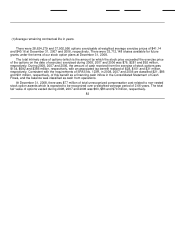
The Directors' Plan also provides for an annual grant to each director of options to purchase 5,000 shares of
common stock at the fair market value on the date of grant. Options generally become exercisable over a four-
year period and expire after ten years.
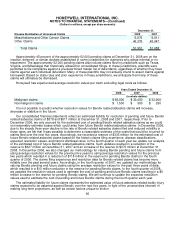
Note 21—Commitments and Contingencies
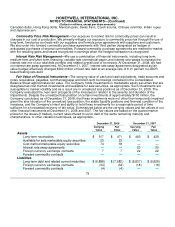
Environmental Matters
We are subject to various federal, state, local and foreign government requirements relating to the protection
of the environment. We believe that, as a general matter, our policies, practices and procedures are properly
designed to prevent unreasonable risk of environmental damage and personal injury and that our handling,
manufacture, use and disposal of hazardous substances are in accordance with environmental and safety laws
and regulations. However, mainly because of past operations and operations of predecessor companies, we, like
other companies engaged in similar businesses, have incurred remedial response and voluntary cleanup costs
for site contamination and are a party to lawsuits and claims associated with environmental and safety matters,
including past production of products containing hazardous substances. Additional lawsuits, claims and costs
involving environmental matters are likely to continue to arise in the future.
84