Honeywell 2008 Annual Report Download - page 91
Download and view the complete annual report
Please find page 91 of the 2008 Honeywell annual report below. You can navigate through the pages in the report by either clicking on the pages listed below, or by using the keyword search tool below to find specific information within the annual report.-
 1
1 -
2
-
3
-
4
-
5
-
6
-
7
-
8
-
9
-
10
-
11
-
12
-
13
-
14
-
15
-
16
-
17
-
18
-
19
-
20
-
21
-
22
-
23
-
24
-
25
-
26
-
27
-
28
-
29
-
30
-
31
-
32
-
33
-
34
-
35
-
36
-
37
-
38
-
39
-
40
-
41
-
42
-
43
-
44
-
45
-
46
-
47
-
48
-
49
-
50
-
51
-
52
-
53
-
54
-
55
-
56
-
57
-
58
-
59
-
60
-
61
-
62
-
63
-
64
-
65
-
66
-
67
-
68
-
69
-
70
-
71
-
72
-
73
-
74
-
75
-
76
-
77
-
78
-
79
-
80
-
 81
81 -
 82
82 -
 83
83 -
 84
84 -
 85
85 -
 86
86 -
 87
87 -
 88
88 -
 89
89 -
 90
90 -
 91
91 -
 92
92 -
 93
93 -
 94
94 -
 95
95 -
 96
96 -
 97
97 -
 98
98 -
 99
99 -
 100
100 -
 101
101 -
102
-
103
-
104
-
105
-
106
-
107
-
108
-
109
-
110
-
111
-
112
-
113
-
114
-
115
-
116
-
117
-
118
-
119
-
120
-
121
-
122
-
123
-
124
-
125
-
126
-
127
-
128
-
129
-
130
-
131
-
132
-
133
-
134
-
135
-
136
-
137
-
138
-
139
-
140
-
141
-
142
-
143
-
144
-
145
-
146
-
147
-
148
-
149
-
150
-
151
-
152
-
153
-
154
-
155
-
156
-
157
-
158
-
159
-
160
-
161
-
162
-
163
-
164
-
165
-
166
-
167
-
168
-
169
-
170
-
171
-
172
-
173
-
174
-
175
-
176
-
177
-
178
-
179
-
180
-
181
-
182
-
183
-
184
-
185
-
186
-
187
-
188
-
189
-
190
-
191
-
192
-
193
-
194
-
195
-
196
-
197
-
198
-
199
-
200
-
201
-
202
-
203
-
204
-
205
-
206
-
207
-
208
-
209
-
210
-
211
-
212
-
213
-
214
-
215
-
216
-
217
-
218
-
219
-
220
-
221
-
222
-
223
-
224
-
225
-
226
-
227
-
228
-
229
-
230
-
231
-
232
-
233
-
234
-
235
-
236
-
237
-
238
-
239
-
240
-
241
-
242
-
243
-
244
-
245
-
246
-
247
-
248
-
249
-
250
-
251
-
252
-
253
-
254
-
255
-
256
-
257
-
258
-
259
-
260
-
261
-
262
-
263
-
264
-
265
-
266
-
267
-
268
-
269
-
270
-
271
-
272
-
273
-
274
-
275
-
276
-
277
-
278
-
279
-
280
-
281
-
282
-
283
-
284
-
285
-
286
-
287
-
288
-
289
-
290
-
291
-
292
-
293
-
294
-
295
-
296
-
297
-
298
-
299
-
300
-
301
-
302
-
303
-
304
-
305
-
306
-
307
-
308
-
309
-
310
-
311
-
312
-
313
-
314
-
315
-
316
-
317
-
318
-
319
-
320
-
321
-
322
-
323
-
324
-
325
-
326
-
327
-
328
-
329
-
330
-
331
-
332
-
333
-
334
-
335
-
336
-
337
-
338
-
339
-
340
-
341
-
342
-
343
-
344
-
345
-
346
-
347
-
348
-
349
-
350
-
351
-
352
 |
 |

HONEYWELL INTERNATIONAL INC.
NOTES TO FINANCIAL STATEMENTS—(Continued)
(Dollars in millions, except per share amounts)
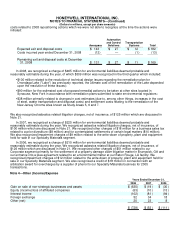
costs related to 2008 repositioning actions which we were not able to recognize at the time the actions were
initiated:
Aerospace
Automation
and Control
Solutions Transportation
Systems Total
Expected exit and disposal costs $ 143 $ 27 $ 12 $ 182
Costs incurred year ended December 31, 2008 (12) — (1) (13)
Remaining exit and disposal costs at December
31, 2008 $ 131 $ 27 $ 11 $ 169
In 2008, we recognized a charge of $465 million for environmental liabilities deemed probable and
reasonably estimable during the year, of which $309 million was recognized in the third quarter which included:
• $100 million related to the resolution of technical design issues regarding the remediation plan for
Onondaga Lake ("Lake") (as previously reported, the ultimate cost of the remediation of the Lake depended
upon the resolution of these issues);
•
$90 million for the estimated cost of proposed remedial actions to be taken at other sites located in
Syracuse, New York in accordance with remediation plans submitted to state environmental regulators;
•
$38 million primarily related to changes in cost estimates (due to, among other things, increases in the cost
of steel, waste transportation and disposal costs) and settlement costs relating to the remediation of the
New Jersey Chrome sites known as Study Areas 5, 6 and 7.
We also recognized asbestos related litigation charges, net of insurance, of $125 million which are discussed in
Note 21.
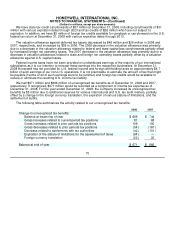
In 2007, we recognized a charge of $225 million for environmental liabilities deemed probable and
reasonably estimable during the year. We recognized asbestos related litigation charges, net of insurance, of
$100 million which are discussed in Note 21. We recognized other charges of $18 million for a business sales tax
related to a prior divestiture ($8 million) and for contemplated settlements of certain legal matters ($10 million).
We also recognized impairment charges of $9 million related to the write-down of property, plant and equipment
held for sale in our Specialty Materials segment.
In 2006, we recognized a charge of $210 million for environmental liabilities deemed probable and
reasonably estimable during the year. We recognized asbestos related litigation charges, net of insurance, of
$126 million which are discussed in Note 21. We recognized other charges of $51 million related to our
Corporate segment primarily for the settlement of a property damage claim litigation matter in Brunswick, GA and
our entrance into a plea agreement related to an environmental matter at our Baton Rouge, LA facility. We
recognized impairment charges of $12 million related to the write-down of property, plant and equipment held for
sale in our Specialty Materials segment. We also recognized a credit of $18 million in connection with an
arbitration award for overcharges by a supplier of phenol to our Specialty Materials business for 2005
transactions.
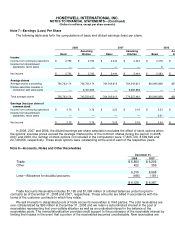
Note 4—Other (Income)/Expense
Years Ended December 31,
2008 2007 2006
Gain on sale of non-strategic businesses and assets $ (635) $ (19) $ (30)
Equity (income)/loss of affiliated companies (63) (10) (13)
Interest income (102) (81) (94)
Foreign exchange 52 34 18
Other (net) 20 23 8
$ (728) $ (53) $ (111)