Honeywell 2008 Annual Report Download - page 134
Download and view the complete annual report
Please find page 134 of the 2008 Honeywell annual report below. You can navigate through the pages in the report by either clicking on the pages listed below, or by using the keyword search tool below to find specific information within the annual report.-
 1
1 -
2
-
3
-
4
-
5
-
6
-
7
-
8
-
9
-
10
-
11
-
12
-
13
-
14
-
15
-
16
-
17
-
18
-
19
-
20
-
21
-
22
-
23
-
24
-
25
-
26
-
27
-
28
-
29
-
30
-
31
-
32
-
33
-
34
-
35
-
36
-
37
-
38
-
39
-
40
-
41
-
42
-
43
-
44
-
45
-
46
-
47
-
48
-
49
-
50
-
51
-
52
-
53
-
54
-
55
-
56
-
57
-
58
-
59
-
60
-
61
-
62
-
63
-
64
-
65
-
66
-
67
-
68
-
69
-
70
-
71
-
72
-
73
-
74
-
75
-
76
-
77
-
78
-
79
-
80
-
81
-
82
-
83
-
84
-
85
-
86
-
87
-
88
-
89
-
90
-
91
-
92
-
93
-
94
-
95
-
96
-
97
-
98
-
99
-
100
-
101
-
102
-
103
-
104
-
105
-
106
-
107
-
108
-
109
-
110
-
111
-
112
-
113
-
114
-
115
-
116
-
117
-
118
-
119
-
120
-
121
-
122
-
123
-
 124
124 -
 125
125 -
 126
126 -
 127
127 -
 128
128 -
 129
129 -
 130
130 -
 131
131 -
 132
132 -
 133
133 -
 134
134 -
 135
135 -
 136
136 -
 137
137 -
 138
138 -
 139
139 -
 140
140 -
 141
141 -
 142
142 -
 143
143 -
 144
144 -
145
-
146
-
147
-
148
-
149
-
150
-
151
-
152
-
153
-
154
-
155
-
156
-
157
-
158
-
159
-
160
-
161
-
162
-
163
-
164
-
165
-
166
-
167
-
168
-
169
-
170
-
171
-
172
-
173
-
174
-
175
-
176
-
177
-
178
-
179
-
180
-
181
-
182
-
183
-
184
-
185
-
186
-
187
-
188
-
189
-
190
-
191
-
192
-
193
-
194
-
195
-
196
-
197
-
198
-
199
-
200
-
201
-
202
-
203
-
204
-
205
-
206
-
207
-
208
-
209
-
210
-
211
-
212
-
213
-
214
-
215
-
216
-
217
-
218
-
219
-
220
-
221
-
222
-
223
-
224
-
225
-
226
-
227
-
228
-
229
-
230
-
231
-
232
-
233
-
234
-
235
-
236
-
237
-
238
-
239
-
240
-
241
-
242
-
243
-
244
-
245
-
246
-
247
-
248
-
249
-
250
-
251
-
252
-
253
-
254
-
255
-
256
-
257
-
258
-
259
-
260
-
261
-
262
-
263
-
264
-
265
-
266
-
267
-
268
-
269
-
270
-
271
-
272
-
273
-
274
-
275
-
276
-
277
-
278
-
279
-
280
-
281
-
282
-
283
-
284
-
285
-
286
-
287
-
288
-
289
-
290
-
291
-
292
-
293
-
294
-
295
-
296
-
297
-
298
-
299
-
300
-
301
-
302
-
303
-
304
-
305
-
306
-
307
-
308
-
309
-
310
-
311
-
312
-
313
-
314
-
315
-
316
-
317
-
318
-
319
-
320
-
321
-
322
-
323
-
324
-
325
-
326
-
327
-
328
-
329
-
330
-
331
-
332
-
333
-
334
-
335
-
336
-
337
-
338
-
339
-
340
-
341
-
342
-
343
-
344
-
345
-
346
-
347
-
348
-
349
-
350
-
351
-
352
 |
 |

HONEYWELL INTERNATIONAL INC.
NOTES TO FINANCIAL STATEMENTS—(Continued)
(Dollars in millions, except per share amounts)
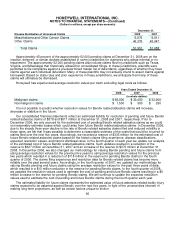
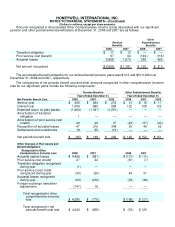
Amounts recognized in Accumulated Other Comprehensive Income (Loss) associated with our significant
pension and other postretirement benefit plans at December 31, 2008 and 2007 are as follows.
Pension
Benefits
Other
Postretirement
Benefits
2008 2007 2008 2007
Transition obligation $ 11 $ 12 $ — $ —
Prior service cost (benefit) 97 94 (140) (116)
Actuarial losses 5,958 1,675 265 429
Net amount recognized $ 6,066 $ 1,781 $ 125 $ 313
The accumulated benefit obligation for our defined benefit pension plans was $14.3 and $16.0 billion at
December 31, 2008 and 2007, respectively.
The components of net periodic benefit cost and other amounts recognized in other comprehensive (income)
loss for our significant plans include the following components:
Net Periodic Benefit Cost
Pension Benefits Other Postretirement Benefits
Years Ended December 31, Years Ended December 31,
2008 2007 2006 2008 2007 2006
Service cost $ 255 $ 264 $ 274 $ 13 $ 15 $ 17
Interest cost 1,009 960 908 122 128 122
Expected return on plan assets (1,404) (1,347) (1,251) — — —
Amortization of transition
obligation 1 — — — — —
Amortization of prior service cost
(credit) 29 26 27 (43) (37) (40)
Recognition of actuarial losses 47 210 348 33 46 52
Settlements and curtailments 18 35 (13) — — —
Net periodic benefit cost $ (45) $ 148 $ 293 $ 125 $ 152 $ 151
Other Changes in Plan Assets and
Benefit Obligations
Recognized in Other
Comprehensive (Income) Loss 2008 2007 2008 2007
Actuarial (gains) losses $ 4,499 $ (581) $ (131) $ (11)
Prior service cost (credit) 27 22 (67) (7)
Transition obligation recognized
during year (1) — — —
Prior service (cost) credit
recognized during year (30) (26) 43 37
Actuarial losses recognized
during year (63) (210) (33) (46)
Foreign exchange translation
adjustments (147) 19 — —
Total recognized in other
comprehensive (income)
loss $ 4,285 $ (776) $ (188) $ (27)
Total recognized in net
periodic benefit cost and $ 4,240 $ (628) $ (63) $ 125