Honeywell 2008 Annual Report Download - page 48
Download and view the complete annual report
Please find page 48 of the 2008 Honeywell annual report below. You can navigate through the pages in the report by either clicking on the pages listed below, or by using the keyword search tool below to find specific information within the annual report.-
 1
1 -
 2
2 -
 3
3 -
 4
4 -
 5
5 -
 6
6 -
 7
7 -
 8
8 -
 9
9 -
 10
10 -
 11
11 -
 12
12 -
 13
13 -
 14
14 -
 15
15 -
 16
16 -
 17
17 -
 18
18 -
 19
19 -
 20
20 -
 21
21 -
 22
22 -
 23
23 -
 24
24 -
 25
25 -
 26
26 -
 27
27 -
 28
28 -
 29
29 -
 30
30 -
 31
31 -
 32
32 -
 33
33 -
 34
34 -
 35
35 -
 36
36 -
 37
37 -
 38
38 -
 39
39 -
 40
40 -
 41
41 -
 42
42 -
 43
43 -
 44
44 -
 45
45 -
 46
46 -
 47
47 -
 48
48 -
 49
49 -
 50
50 -
 51
51 -
 52
52 -
 53
53 -
 54
54 -
 55
55 -
 56
56 -
 57
57 -
 58
58 -
 59
59 -
 60
60 -
 61
61 -
 62
62 -
 63
63 -
 64
64 -
 65
65 -
 66
66 -
 67
67 -
 68
68 -
 69
69 -
 70
70 -
 71
71 -
 72
72 -
 73
73 -
 74
74 -
 75
75 -
 76
76 -
 77
77 -
 78
78 -
 79
79 -
 80
80 -
 81
81 -
 82
82 -
 83
83 -
 84
84 -
 85
85 -
 86
86 -
 87
87 -
 88
88 -
 89
89 -
 90
90 -
 91
91 -
 92
92 -
 93
93 -
 94
94 -
 95
95 -
 96
96 -
 97
97 -
 98
98 -
 99
99 -
 100
100 -
 101
101 -
 102
102 -
 103
103 -
 104
104 -
 105
105 -
 106
106 -
 107
107 -
 108
108 -
 109
109 -
 110
110 -
 111
111 -
 112
112 -
 113
113 -
 114
114 -
 115
115 -
 116
116 -
 117
117 -
 118
118 -
 119
119 -
 120
120 -
 121
121 -
 122
122 -
 123
123 -
 124
124 -
 125
125 -
 126
126 -
 127
127 -
 128
128 -
 129
129 -
 130
130 -
 131
131 -
 132
132 -
 133
133 -
 134
134 -
 135
135 -
 136
136 -
 137
137 -
 138
138 -
 139
139 -
 140
140 -
 141
141 -
 142
142 -
 143
143 -
 144
144 -
 145
145 -
 146
146 -
 147
147 -
 148
148 -
 149
149 -
 150
150 -
 151
151 -
 152
152 -
 153
153 -
 154
154 -
 155
155 -
 156
156 -
 157
157 -
 158
158 -
 159
159 -
 160
160 -
 161
161 -
 162
162 -
 163
163 -
 164
164 -
 165
165 -
 166
166 -
 167
167 -
 168
168 -
 169
169 -
 170
170 -
 171
171 -
 172
172 -
 173
173 -
 174
174 -
 175
175 -
 176
176 -
 177
177 -
 178
178 -
 179
179 -
 180
180 -
 181
181 -
 182
182 -
 183
183 -
 184
184 -
 185
185 -
 186
186 -
 187
187 -
 188
188 -
 189
189 -
 190
190 -
 191
191 -
 192
192 -
 193
193 -
 194
194 -
 195
195 -
 196
196 -
 197
197 -
 198
198 -
 199
199 -
 200
200 -
 201
201 -
 202
202 -
 203
203 -
 204
204 -
 205
205 -
 206
206 -
 207
207 -
 208
208 -
 209
209 -
 210
210 -
 211
211 -
 212
212 -
 213
213 -
 214
214 -
 215
215 -
 216
216 -
 217
217 -
 218
218 -
 219
219 -
 220
220 -
 221
221 -
 222
222 -
 223
223 -
 224
224 -
 225
225 -
 226
226 -
 227
227 -
 228
228 -
 229
229 -
 230
230 -
 231
231 -
 232
232 -
 233
233 -
 234
234 -
 235
235 -
 236
236 -
 237
237 -
 238
238 -
 239
239 -
 240
240 -
 241
241 -
 242
242 -
 243
243 -
 244
244 -
 245
245 -
 246
246 -
 247
247 -
 248
248 -
 249
249 -
 250
250 -
 251
251 -
 252
252 -
 253
253 -
 254
254 -
 255
255 -
 256
256 -
 257
257 -
 258
258 -
 259
259 -
 260
260 -
 261
261 -
 262
262 -
 263
263 -
 264
264 -
 265
265 -
 266
266 -
 267
267 -
 268
268 -
 269
269 -
 270
270 -
 271
271 -
 272
272 -
 273
273 -
 274
274 -
 275
275 -
 276
276 -
 277
277 -
 278
278 -
 279
279 -
 280
280 -
 281
281 -
 282
282 -
 283
283 -
 284
284 -
 285
285 -
 286
286 -
 287
287 -
 288
288 -
 289
289 -
 290
290 -
 291
291 -
 292
292 -
 293
293 -
 294
294 -
 295
295 -
 296
296 -
 297
297 -
 298
298 -
 299
299 -
 300
300 -
 301
301 -
 302
302 -
 303
303 -
 304
304 -
 305
305 -
 306
306 -
 307
307 -
 308
308 -
 309
309 -
 310
310 -
 311
311 -
 312
312 -
 313
313 -
 314
314 -
 315
315 -
 316
316 -
 317
317 -
 318
318 -
 319
319 -
 320
320 -
 321
321 -
 322
322 -
 323
323 -
 324
324 -
 325
325 -
 326
326 -
 327
327 -
 328
328 -
 329
329 -
 330
330 -
 331
331 -
 332
332 -
 333
333 -
 334
334 -
 335
335 -
 336
336 -
 337
337 -
 338
338 -
 339
339 -
 340
340 -
 341
341 -
 342
342 -
 343
343 -
 344
344 -
 345
345 -
 346
346 -
 347
347 -
 348
348 -
 349
349 -
 350
350 -
 351
351 -
 352
352
 |
 |

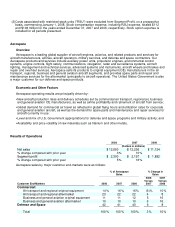
Specialty Materials segment profit increased by 10 percent in 2008 compared with 2007. This increase is due
principally to increased UOP, Fluorine Products and Resins and Chemicals sales as a result of the factors
discussed above and higher income from our joint ventures, partially offset by the impacts of hurricanes Gustav
and Ike and the fourth quarter sales decline noted below. Overall, the effects of increased pricing reflecting the
pass-through of higher raw material costs and other pricing actions (including benefits from formula based pricing
arrangements) and productivity gains more than offset raw material (most significantly sulfur) and other inflation.
In 2009, we expect continued declines in global demand for commodities such as caprolactam and
ammonium sulfate, as well as demand from semiconductor customers, and delays in the timing of new unit
deliveries of UOP products and catalyst reloads.
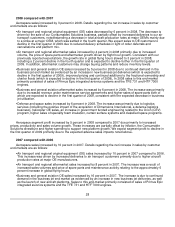
2007 compared with 2006
Specialty Materials sales increased by 5 percent in 2007 compared to 2006 driven by (i) a 16 percent
increase in UOP sales primarily as a result of higher volume in its projects business principally due to capacity
expansion in the refining and petrochemical industries and (ii) a 4 percent increase in Specialty Products sales
due in large part to increased sales of electronic chemicals and specialty additives and higher sales to customers
in the health care industry. Partially offsetting these increases was a 6 percent decrease in Fluorine Products
sales primarily due to lower refrigerant pricing and lower sales volume of foam blowing agents used in insulating
material as a result of continued weakness in the U.S. housing market.
Specialty Materials segment profit increased by 16 percent in 2007 compared with 2006 principally due to
increased UOP and Specialty Products sales partially offset by the decline in Fluorine Products sales as a result
of the factors discussed above. Additionally, the effects of increased pricing and productivity more than offset raw
material and other cost inflation.
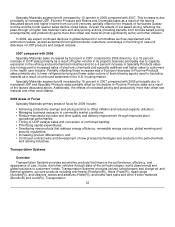
2009 Areas of Focus
Specialty Materials primary areas of focus for 2009 include:
• Achieving productivity savings and pricing actions to offset inflation and reduced capacity utilization;
• Managing business exposure to commodity market conditions;
• Reduce manufacturing costs and drive quality and delivery improvement through improved plant
operational performance;
• Timing of UOP catalyst sales and conversion of confirmed backlog;
• Prioritizing capital expenditures;
• Developing new products that address energy efficiency, renewable energy sources, global warming and
security regulations;
• Increasing product differentiation; and
• Continued contract wins and development of new process technologies and products in the petrochemical
and refining industries.
Transportation Systems
Overview
Transportation Systems provides automotive products that improve the performance, efficiency, and
appearance of cars, trucks, and other vehicles through state-of-the-art technologies, world class brands and
global solutions to customers' needs. Transportation Systems' products include turbochargers and charge-air and
thermal systems; car care products including anti-freeze (Prestone(R)), filters (Fram(R)), spark plugs
(Autolite(R)), and cleaners, waxes and additives (Holts(R)); and brake hard parts and other friction materials
(Bendix(R) and Jurid(R)). Transportation
32
