Honeywell 2008 Annual Report Download - page 34
Download and view the complete annual report
Please find page 34 of the 2008 Honeywell annual report below. You can navigate through the pages in the report by either clicking on the pages listed below, or by using the keyword search tool below to find specific information within the annual report.-
 1
1 -
2
-
3
-
4
-
5
-
6
-
7
-
8
-
9
-
10
-
11
-
12
-
13
-
14
-
15
-
16
-
17
-
18
-
19
-
20
-
21
-
22
-
23
-
 24
24 -
 25
25 -
 26
26 -
 27
27 -
 28
28 -
 29
29 -
 30
30 -
 31
31 -
 32
32 -
 33
33 -
 34
34 -
 35
35 -
 36
36 -
 37
37 -
 38
38 -
 39
39 -
 40
40 -
 41
41 -
 42
42 -
 43
43 -
 44
44 -
45
-
46
-
47
-
48
-
49
-
50
-
51
-
52
-
53
-
54
-
55
-
56
-
57
-
58
-
59
-
60
-
61
-
62
-
63
-
64
-
65
-
66
-
67
-
68
-
69
-
70
-
71
-
72
-
73
-
74
-
75
-
76
-
77
-
78
-
79
-
80
-
81
-
82
-
83
-
84
-
85
-
86
-
87
-
88
-
89
-
90
-
91
-
92
-
93
-
94
-
95
-
96
-
97
-
98
-
99
-
100
-
101
-
102
-
103
-
104
-
105
-
106
-
107
-
108
-
109
-
110
-
111
-
112
-
113
-
114
-
115
-
116
-
117
-
118
-
119
-
120
-
121
-
122
-
123
-
124
-
125
-
126
-
127
-
128
-
129
-
130
-
131
-
132
-
133
-
134
-
135
-
136
-
137
-
138
-
139
-
140
-
141
-
142
-
143
-
144
-
145
-
146
-
147
-
148
-
149
-
150
-
151
-
152
-
153
-
154
-
155
-
156
-
157
-
158
-
159
-
160
-
161
-
162
-
163
-
164
-
165
-
166
-
167
-
168
-
169
-
170
-
171
-
172
-
173
-
174
-
175
-
176
-
177
-
178
-
179
-
180
-
181
-
182
-
183
-
184
-
185
-
186
-
187
-
188
-
189
-
190
-
191
-
192
-
193
-
194
-
195
-
196
-
197
-
198
-
199
-
200
-
201
-
202
-
203
-
204
-
205
-
206
-
207
-
208
-
209
-
210
-
211
-
212
-
213
-
214
-
215
-
216
-
217
-
218
-
219
-
220
-
221
-
222
-
223
-
224
-
225
-
226
-
227
-
228
-
229
-
230
-
231
-
232
-
233
-
234
-
235
-
236
-
237
-
238
-
239
-
240
-
241
-
242
-
243
-
244
-
245
-
246
-
247
-
248
-
249
-
250
-
251
-
252
-
253
-
254
-
255
-
256
-
257
-
258
-
259
-
260
-
261
-
262
-
263
-
264
-
265
-
266
-
267
-
268
-
269
-
270
-
271
-
272
-
273
-
274
-
275
-
276
-
277
-
278
-
279
-
280
-
281
-
282
-
283
-
284
-
285
-
286
-
287
-
288
-
289
-
290
-
291
-
292
-
293
-
294
-
295
-
296
-
297
-
298
-
299
-
300
-
301
-
302
-
303
-
304
-
305
-
306
-
307
-
308
-
309
-
310
-
311
-
312
-
313
-
314
-
315
-
316
-
317
-
318
-
319
-
320
-
321
-
322
-
323
-
324
-
325
-
326
-
327
-
328
-
329
-
330
-
331
-
332
-
333
-
334
-
335
-
336
-
337
-
338
-
339
-
340
-
341
-
342
-
343
-
344
-
345
-
346
-
347
-
348
-
349
-
350
-
351
-
352
 |
 |

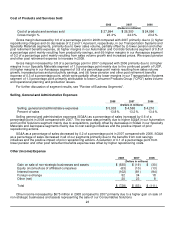
business and higher income from equity method investments (mainly in our Specialty Material segment).
Other income decreased by $58 million, or 52 percent in 2007 compared to 2006 primarily as a result of
lower interest income due to interest received on a favorable tax settlement in 2006 and higher foreign exchange
losses due to changes in exchange rates.
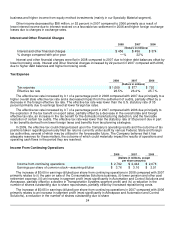
Interest and Other Financial Charges
2008 2007 2006
(Dollars in millions)
Interest and other financial charges $ 456 $ 456 $ 374
% change compared with prior year —% 22%
Interest and other financial charges were flat in 2008 compared to 2007 due to higher debt balances offset by
lower borrowing costs. Interest and other financial charges increased by 22 percent in 2007 compared with 2006,
due to higher debt balances and higher borrowing costs.
Tax Expense
2008 2007 2006
(Dollars in millions)
Tax expense $ 1,009 $ 877 $ 720
Effective tax rate 26.5% 26.4% 25.7%
The effective tax rate increased by 0.1 of a percentage point in 2008 compared with 2007 due principally to a
higher overall state effective tax rate and a decreased impact from the settlement of audits, partially offset by a
decrease in the foreign effective tax rate. The effective tax rate was lower than the U.S. statutory rate of 35
percent primarily due to earnings taxed at lower foreign tax rates.
The effective tax rate increased by 0.7 of a percentage point in 2007 compared with 2006 due principally to
the expiration of the tax benefit on export sales, partially offset by a decrease in the overall state and foreign
effective tax rate, an increase in the tax benefit for the domestic manufacturing deduction, and the favorable
resolution of certain tax audits. The effective tax rate was lower than the statutory rate of 35 percent due in part
to tax benefits derived from lower foreign taxes and benefits from tax planning strategies.
In 2009, the effective tax could change based upon the Company's operating results and the outcome of tax
positions taken regarding previously filed tax returns currently under audit by various Federal, State and foreign
tax authorities, several of which may be utilized in the foreseeable future. The Company believes that it has
adequate reserves for these matters, the outcome of which could materially impact the results of operations and
operating cash flows in the period they are resolved.
Income From Continuing Operations
2008 2007 2006
(Dollars in millions, except
per share amounts)
Income from continuing operations $ 2,792 $ 2,444 $ 2,078
Earnings per share of common stock—assuming dilution $ 3.76 $ 3.16 $ 2.51
The increase of $0.60 in earnings (diluted) per share from continuing operations in 2008 compared with 2007
primarily relates to (i) the gain on sale of the Consumables Solutions business, (ii) lower pension and other post
retirement expense, (iii) an increase in segment profit (most significantly in Automation and Control Solutions and
Aerospace, partially offset by a decline in Transportation Systems segment profit) and (iv) a reduction in the
number of shares outstanding due to share repurchases, partially offset by increased repositioning costs.
The increase of $0.65 in earnings (diluted) per share from continuing operations in 2007 compared with 2006
primarily relates to an increase in segment profit (most significantly in Aerospace and Automation and Control
Solutions), a reduction in the number of shares outstanding due to share
24