Honeywell 2008 Annual Report Download - page 17
Download and view the complete annual report
Please find page 17 of the 2008 Honeywell annual report below. You can navigate through the pages in the report by either clicking on the pages listed below, or by using the keyword search tool below to find specific information within the annual report.-
 1
1 -
 2
2 -
 3
3 -
 4
4 -
 5
5 -
 6
6 -
 7
7 -
 8
8 -
 9
9 -
 10
10 -
 11
11 -
 12
12 -
 13
13 -
 14
14 -
 15
15 -
 16
16 -
 17
17 -
 18
18 -
 19
19 -
 20
20 -
 21
21 -
 22
22 -
 23
23 -
 24
24 -
 25
25 -
 26
26 -
 27
27 -
 28
28 -
 29
29 -
 30
30 -
 31
31 -
 32
32 -
 33
33 -
 34
34 -
 35
35 -
 36
36 -
 37
37 -
 38
38 -
 39
39 -
 40
40 -
 41
41 -
 42
42 -
 43
43 -
 44
44 -
 45
45 -
 46
46 -
 47
47 -
 48
48 -
 49
49 -
 50
50 -
 51
51 -
 52
52 -
 53
53 -
 54
54 -
 55
55 -
 56
56 -
 57
57 -
 58
58 -
 59
59 -
 60
60 -
 61
61 -
 62
62 -
 63
63 -
 64
64 -
 65
65 -
 66
66 -
 67
67 -
 68
68 -
 69
69 -
 70
70 -
 71
71 -
 72
72 -
 73
73 -
 74
74 -
 75
75 -
 76
76 -
 77
77 -
 78
78 -
 79
79 -
 80
80 -
 81
81 -
 82
82 -
 83
83 -
 84
84 -
 85
85 -
 86
86 -
 87
87 -
 88
88 -
 89
89 -
 90
90 -
 91
91 -
 92
92 -
 93
93 -
 94
94 -
 95
95 -
 96
96 -
 97
97 -
 98
98 -
 99
99 -
 100
100 -
 101
101 -
 102
102 -
 103
103 -
 104
104 -
 105
105 -
 106
106 -
 107
107 -
 108
108 -
 109
109 -
 110
110 -
 111
111 -
 112
112 -
 113
113 -
 114
114 -
 115
115 -
 116
116 -
 117
117 -
 118
118 -
 119
119 -
 120
120 -
 121
121 -
 122
122 -
 123
123 -
 124
124 -
 125
125 -
 126
126 -
 127
127 -
 128
128 -
 129
129 -
 130
130 -
 131
131 -
 132
132 -
 133
133 -
 134
134 -
 135
135 -
 136
136 -
 137
137 -
 138
138 -
 139
139 -
 140
140 -
 141
141 -
 142
142 -
 143
143 -
 144
144 -
 145
145 -
 146
146 -
 147
147 -
 148
148 -
 149
149 -
 150
150 -
 151
151 -
 152
152 -
 153
153 -
 154
154 -
 155
155 -
 156
156 -
 157
157 -
 158
158 -
 159
159 -
 160
160 -
 161
161 -
 162
162 -
 163
163 -
 164
164 -
 165
165 -
 166
166 -
 167
167 -
 168
168 -
 169
169 -
 170
170 -
 171
171 -
 172
172 -
 173
173 -
 174
174 -
 175
175 -
 176
176 -
 177
177 -
 178
178 -
 179
179 -
 180
180 -
 181
181 -
 182
182 -
 183
183 -
 184
184 -
 185
185 -
 186
186 -
 187
187 -
 188
188 -
 189
189 -
 190
190 -
 191
191 -
 192
192 -
 193
193 -
 194
194 -
 195
195 -
 196
196 -
 197
197 -
 198
198 -
 199
199 -
 200
200 -
 201
201 -
 202
202 -
 203
203 -
 204
204 -
 205
205 -
 206
206 -
 207
207 -
 208
208 -
 209
209 -
 210
210 -
 211
211 -
 212
212 -
 213
213 -
 214
214 -
 215
215 -
 216
216 -
 217
217 -
 218
218 -
 219
219 -
 220
220 -
 221
221 -
 222
222 -
 223
223 -
 224
224 -
 225
225 -
 226
226 -
 227
227 -
 228
228 -
 229
229 -
 230
230 -
 231
231 -
 232
232 -
 233
233 -
 234
234 -
 235
235 -
 236
236 -
 237
237 -
 238
238 -
 239
239 -
 240
240 -
 241
241 -
 242
242 -
 243
243 -
 244
244 -
 245
245 -
 246
246 -
 247
247 -
 248
248 -
 249
249 -
 250
250 -
 251
251 -
 252
252 -
 253
253 -
 254
254 -
 255
255 -
 256
256 -
 257
257 -
 258
258 -
 259
259 -
 260
260 -
 261
261 -
 262
262 -
 263
263 -
 264
264 -
 265
265 -
 266
266 -
 267
267 -
 268
268 -
 269
269 -
 270
270 -
 271
271 -
 272
272 -
 273
273 -
 274
274 -
 275
275 -
 276
276 -
 277
277 -
 278
278 -
 279
279 -
 280
280 -
 281
281 -
 282
282 -
 283
283 -
 284
284 -
 285
285 -
 286
286 -
 287
287 -
 288
288 -
 289
289 -
 290
290 -
 291
291 -
 292
292 -
 293
293 -
 294
294 -
 295
295 -
 296
296 -
 297
297 -
 298
298 -
 299
299 -
 300
300 -
 301
301 -
 302
302 -
 303
303 -
 304
304 -
 305
305 -
 306
306 -
 307
307 -
 308
308 -
 309
309 -
 310
310 -
 311
311 -
 312
312 -
 313
313 -
 314
314 -
 315
315 -
 316
316 -
 317
317 -
 318
318 -
 319
319 -
 320
320 -
 321
321 -
 322
322 -
 323
323 -
 324
324 -
 325
325 -
 326
326 -
 327
327 -
 328
328 -
 329
329 -
 330
330 -
 331
331 -
 332
332 -
 333
333 -
 334
334 -
 335
335 -
 336
336 -
 337
337 -
 338
338 -
 339
339 -
 340
340 -
 341
341 -
 342
342 -
 343
343 -
 344
344 -
 345
345 -
 346
346 -
 347
347 -
 348
348 -
 349
349 -
 350
350 -
 351
351 -
 352
352
 |
 |

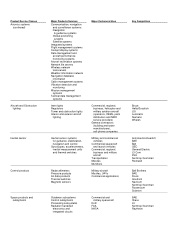
International Operations
We are engaged in manufacturing, sales, service and research and development mainly in the United States,
Europe, Canada, Asia and Latin America. U.S. exports and foreign manufactured products are significant to our
operations. U.S. exports comprised 10, 10 and 11 percent of our total sales in 2008, 2007 and 2006,
respectively. Foreign manufactured products and services, mainly in Europe, were 39, 39 and 37 percent of our
total sales in 2008, 2007 and 2006, respectively.
Approximately 19 percent of total 2008 sales of Aerospace-related products and services were exports of
U.S. manufactured products and systems and performance of services such as aircraft repair and overhaul.
Exports were principally made to Europe, Canada, Asia and Latin America. Foreign manufactured products and
systems and performance of services comprised approximately 14 percent of total 2008 Aerospace sales. The
principal manufacturing facilities outside the U.S. are in Europe, with less significant operations in Canada and
Asia.
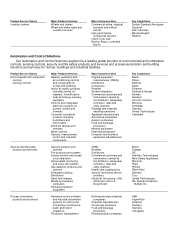
Approximately 2 percent of total 2008 sales of Automation and Control Solutions products were exports of
U.S. manufactured products. Foreign manufactured products and performance of services accounted for 57
percent of total 2008 Automation and Control Solutions sales. The principal manufacturing facilities outside the
U.S. are in Europe with less significant operations in Asia and Canada.
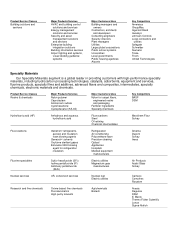
Approximately 14 percent of total 2008 sales of Specialty Materials products and services were exports of
U.S. manufactured products. Exports were principally made to Asia and Latin America. Foreign manufactured
products and performance of services comprised 24 percent of total 2008 Specialty Materials sales. The principal
manufacturing facilities outside the U.S. are in Europe, with less significant operations in Asia and Canada.
Exports of U.S. manufactured products comprised 1 percent of total 2008 sales of Transportation Systems
products. Foreign manufactured products accounted for 71 percent of total 2008 sales of Transportation
Systems. The principal manufacturing facilities outside the U.S. are in Europe, with less significant operations in
Asia and Latin America.
Financial information including net sales and long-lived assets related to geographic areas is included in
Note 24 of Notes to Financial Statements in "Item 8. Financial Statements and Supplementary Data". Information
regarding the economic, political, regulatory and other risks associated with international operations is included in
"Item 1A. Risk Factors."
Raw Materials
The principal raw materials used in our operations are generally readily available. We experienced no
significant problems in the purchase of key raw materials and commodities in 2008. We are not dependent on
any one supplier for a material amount of our raw materials, except related to phenol, a raw material used in our
Specialty Materials segment. We purchase phenol under a supply agreement with one supplier. We have no
reason to believe there is any material risk to this supply.
The costs of certain key raw materials, including natural gas, benzene (the key component in phenol),
ethylene, fluorspar and sulfur in our Specialty Materials business, steel, nickel, other metals and ethylene glycol
in our Transportation Systems business, and nickel, titanium and other metals in our Aerospace business, are
expected to remain volatile. In addition, in 2008 certain large long-term fixed supplier price agreements expired,
primarily relating to components used by our Aerospace business, which in the aggregate, subjected us to higher
volatility in certain component costs. We will continue to attempt to offset raw material cost increases with formula
or long-term supply agreements, price increases and hedging activities where feasible. We have no reason to
believe a shortage of raw materials will cause any material adverse impact during 2009. See "Item 1A. Risk
Factors" for further discussion.
We are highly dependent on our suppliers and subcontractors in order to meet commitments to our
customers. In addition, many major components and product equipment items are procured or subcontracted on
a single-source basis with a number of domestic and foreign companies. We maintain a qualification and
performance surveillance process to control risk associated with such reliance on third parties. While we believe
that sources of supply for raw materials and components are
8
