Honeywell 2008 Annual Report Download - page 41
Download and view the complete annual report
Please find page 41 of the 2008 Honeywell annual report below. You can navigate through the pages in the report by either clicking on the pages listed below, or by using the keyword search tool below to find specific information within the annual report.-
 1
1 -
2
-
3
-
4
-
5
-
6
-
7
-
8
-
9
-
10
-
11
-
12
-
13
-
14
-
15
-
16
-
17
-
18
-
19
-
20
-
21
-
22
-
23
-
24
-
25
-
26
-
27
-
28
-
29
-
30
-
 31
31 -
 32
32 -
 33
33 -
 34
34 -
 35
35 -
 36
36 -
 37
37 -
 38
38 -
 39
39 -
 40
40 -
 41
41 -
 42
42 -
 43
43 -
 44
44 -
 45
45 -
 46
46 -
 47
47 -
 48
48 -
 49
49 -
 50
50 -
 51
51 -
52
-
53
-
54
-
55
-
56
-
57
-
58
-
59
-
60
-
61
-
62
-
63
-
64
-
65
-
66
-
67
-
68
-
69
-
70
-
71
-
72
-
73
-
74
-
75
-
76
-
77
-
78
-
79
-
80
-
81
-
82
-
83
-
84
-
85
-
86
-
87
-
88
-
89
-
90
-
91
-
92
-
93
-
94
-
95
-
96
-
97
-
98
-
99
-
100
-
101
-
102
-
103
-
104
-
105
-
106
-
107
-
108
-
109
-
110
-
111
-
112
-
113
-
114
-
115
-
116
-
117
-
118
-
119
-
120
-
121
-
122
-
123
-
124
-
125
-
126
-
127
-
128
-
129
-
130
-
131
-
132
-
133
-
134
-
135
-
136
-
137
-
138
-
139
-
140
-
141
-
142
-
143
-
144
-
145
-
146
-
147
-
148
-
149
-
150
-
151
-
152
-
153
-
154
-
155
-
156
-
157
-
158
-
159
-
160
-
161
-
162
-
163
-
164
-
165
-
166
-
167
-
168
-
169
-
170
-
171
-
172
-
173
-
174
-
175
-
176
-
177
-
178
-
179
-
180
-
181
-
182
-
183
-
184
-
185
-
186
-
187
-
188
-
189
-
190
-
191
-
192
-
193
-
194
-
195
-
196
-
197
-
198
-
199
-
200
-
201
-
202
-
203
-
204
-
205
-
206
-
207
-
208
-
209
-
210
-
211
-
212
-
213
-
214
-
215
-
216
-
217
-
218
-
219
-
220
-
221
-
222
-
223
-
224
-
225
-
226
-
227
-
228
-
229
-
230
-
231
-
232
-
233
-
234
-
235
-
236
-
237
-
238
-
239
-
240
-
241
-
242
-
243
-
244
-
245
-
246
-
247
-
248
-
249
-
250
-
251
-
252
-
253
-
254
-
255
-
256
-
257
-
258
-
259
-
260
-
261
-
262
-
263
-
264
-
265
-
266
-
267
-
268
-
269
-
270
-
271
-
272
-
273
-
274
-
275
-
276
-
277
-
278
-
279
-
280
-
281
-
282
-
283
-
284
-
285
-
286
-
287
-
288
-
289
-
290
-
291
-
292
-
293
-
294
-
295
-
296
-
297
-
298
-
299
-
300
-
301
-
302
-
303
-
304
-
305
-
306
-
307
-
308
-
309
-
310
-
311
-
312
-
313
-
314
-
315
-
316
-
317
-
318
-
319
-
320
-
321
-
322
-
323
-
324
-
325
-
326
-
327
-
328
-
329
-
330
-
331
-
332
-
333
-
334
-
335
-
336
-
337
-
338
-
339
-
340
-
341
-
342
-
343
-
344
-
345
-
346
-
347
-
348
-
349
-
350
-
351
-
352
 |
 |

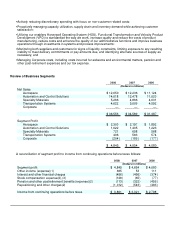
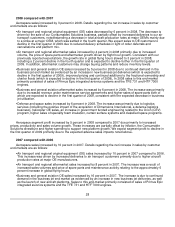
2008 compared with 2007
Aerospace sales increased by 3 percent in 2008. Details regarding the net increase in sales by customer
end-markets are as follows:
• Air transport and regional original equipment (OE) sales decreased by 6 percent in 2008. The decrease is
driven by the sale of our Consumables Solutions business, partially offset by increased deliveries to our air
transport customers, notwithstanding a decrease in total aircraft production rates at major OEM's mainly due
to a strike at a major OEM, which was settled in the fourth quarter. We expect sales to OE customers to
decline in the first quarter of 2009 due to reduced delivery schedules in light of order deferrals and
cancellations and platform mix.
•
Air transport and regional aftermarket sales increased by 4 percent in 2008 primarily due to increased
volume, the price of spare parts and aftermarket growth driven by flight hour growth. Consistent with our
previously reported expectations, the growth rate in global flying hours slowed to 3 percent in 2008,
including a 2 percent decline in the fourth quarter and is expected to decline further in the first quarter of
2009. In addition, aftermarket customers may change buying patterns and reduce inventory levels.
•
Business and general aviation OE sales increased by 5 percent in 2008 due to continued demand in the
business jet end market as evidenced by an increase in new business jet deliveries (which is expected to
decline in the first quarter of 2009), improved pricing and continued additions to the fractional ownership and
charter fleets (which is expected to decline in the first quarter of 2009). In 2008 sales to this end-market
primarily consisted of sales of Primus Epic integrated avionics systems and the TFE 731 and HTF 7000
engines.
•
Business and general aviation aftermarket sales increased by 6 percent in 2008. The increase was primarily
due to increased revenue under maintenance service agreements and higher sales of spare parts both of
which are expected to decline in the first quarter of 2009, consistent with the expected decrease in business
jet utilization.
•
Defense and space sales increased by 6 percent in 2008. The increase was primarily due to logistics
services (including the positive impact of the acquisition of Dimensions International, a defense logistics
business), helicopter OE sales, an increase in government funded engineering related to the Orion (CEV)
program, higher sales of specialty foam insulation, certain surface systems and classified space programs.
Aerospace segment profit increased by 5 percent in 2008 compared to 2007 due primarily to increased
prices, productivity and sales volume growth. These increases are partially offset by inflation, the Consumable
Solutions divestiture and higher spending to support new platform growth. We expect segment profit to decline in
the first quarter of 2009 primarily due to the expected adverse sales impacts noted above.
2007 compared with 2006
Aerospace sales increased by 10 percent in 2007. Details regarding the net increase in sales by customer
end-markets are as follows:
• Air transport and regional original equipment (OE) sales increased by 10 percent in 2007 compared to 2006.
This increase was driven by increased deliveries to air transport customers primarily due to higher aircraft
production rates at major OE manufacturers.
•
Air transport and regional aftermarket sales increased by 8 percent in 2007. The increase was a result of
increased sales volumes and price of spare parts and maintenance activity relating to the approximately 6
percent increase in global flying hours.
•
Business and general aviation OE sales increased by 16 percent in 2007. The increase is due to continued
demand in the business jet end market as evidenced by an increase in new business jet deliveries, as well
as the launch of new aircraft platforms. Sales to this end-market primarily consisted of sales of Primus Epic
integrated avionics systems and the TFE 731 and HTF 7000 engines.
28