Honeywell 2008 Annual Report Download - page 109
Download and view the complete annual report
Please find page 109 of the 2008 Honeywell annual report below. You can navigate through the pages in the report by either clicking on the pages listed below, or by using the keyword search tool below to find specific information within the annual report.-
 1
1 -
2
-
3
-
4
-
5
-
6
-
7
-
8
-
9
-
10
-
11
-
12
-
13
-
14
-
15
-
16
-
17
-
18
-
19
-
20
-
21
-
22
-
23
-
24
-
25
-
26
-
27
-
28
-
29
-
30
-
31
-
32
-
33
-
34
-
35
-
36
-
37
-
38
-
39
-
40
-
41
-
42
-
43
-
44
-
45
-
46
-
47
-
48
-
49
-
50
-
51
-
52
-
53
-
54
-
55
-
56
-
57
-
58
-
59
-
60
-
61
-
62
-
63
-
64
-
65
-
66
-
67
-
68
-
69
-
70
-
71
-
72
-
73
-
74
-
75
-
76
-
77
-
78
-
79
-
80
-
81
-
82
-
83
-
84
-
85
-
86
-
87
-
88
-
89
-
90
-
91
-
92
-
93
-
94
-
95
-
96
-
97
-
98
-
 99
99 -
 100
100 -
 101
101 -
 102
102 -
 103
103 -
 104
104 -
 105
105 -
 106
106 -
 107
107 -
 108
108 -
 109
109 -
 110
110 -
 111
111 -
 112
112 -
 113
113 -
 114
114 -
 115
115 -
 116
116 -
 117
117 -
 118
118 -
 119
119 -
120
-
121
-
122
-
123
-
124
-
125
-
126
-
127
-
128
-
129
-
130
-
131
-
132
-
133
-
134
-
135
-
136
-
137
-
138
-
139
-
140
-
141
-
142
-
143
-
144
-
145
-
146
-
147
-
148
-
149
-
150
-
151
-
152
-
153
-
154
-
155
-
156
-
157
-
158
-
159
-
160
-
161
-
162
-
163
-
164
-
165
-
166
-
167
-
168
-
169
-
170
-
171
-
172
-
173
-
174
-
175
-
176
-
177
-
178
-
179
-
180
-
181
-
182
-
183
-
184
-
185
-
186
-
187
-
188
-
189
-
190
-
191
-
192
-
193
-
194
-
195
-
196
-
197
-
198
-
199
-
200
-
201
-
202
-
203
-
204
-
205
-
206
-
207
-
208
-
209
-
210
-
211
-
212
-
213
-
214
-
215
-
216
-
217
-
218
-
219
-
220
-
221
-
222
-
223
-
224
-
225
-
226
-
227
-
228
-
229
-
230
-
231
-
232
-
233
-
234
-
235
-
236
-
237
-
238
-
239
-
240
-
241
-
242
-
243
-
244
-
245
-
246
-
247
-
248
-
249
-
250
-
251
-
252
-
253
-
254
-
255
-
256
-
257
-
258
-
259
-
260
-
261
-
262
-
263
-
264
-
265
-
266
-
267
-
268
-
269
-
270
-
271
-
272
-
273
-
274
-
275
-
276
-
277
-
278
-
279
-
280
-
281
-
282
-
283
-
284
-
285
-
286
-
287
-
288
-
289
-
290
-
291
-
292
-
293
-
294
-
295
-
296
-
297
-
298
-
299
-
300
-
301
-
302
-
303
-
304
-
305
-
306
-
307
-
308
-
309
-
310
-
311
-
312
-
313
-
314
-
315
-
316
-
317
-
318
-
319
-
320
-
321
-
322
-
323
-
324
-
325
-
326
-
327
-
328
-
329
-
330
-
331
-
332
-
333
-
334
-
335
-
336
-
337
-
338
-
339
-
340
-
341
-
342
-
343
-
344
-
345
-
346
-
347
-
348
-
349
-
350
-
351
-
352
 |
 |
HONEYWELL INTERNATIONAL INC.
NOTES TO FINANCIAL STATEMENTS—(Continued)
(Dollars in millions, except per share amounts)
Canadian dollar, Hong Kong dollar, Mexican peso, Swiss franc, Czech koruna, Chinese renminbi, Indian rupee
and Japanese yen.
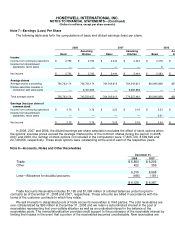
Commodity Price Risk Management—Our exposure to market risk for commodity prices can result in
changes in our cost of production. We primarily mitigate our exposure to commodity price risk through the use of
long-term, fixed-price contracts with our suppliers and formula price agreements with suppliers and customers.
We also enter into forward commodity purchase agreements with third parties designated as hedges of
anticipated purchases of several commodities. Forward commodity purchase agreements are marked-to-market,
with the resulting gains and losses recognized in earnings when the hedged transaction is recognized.
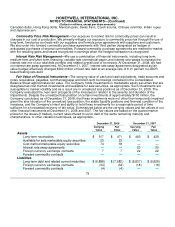
Interest Rate Risk Management—We use a combination of financial instruments, including long-term,
medium-term and short-term financing, variable-rate commercial paper, and interest rate swaps to manage the
interest rate mix of our total debt portfolio and related overall cost of borrowing. At December 31, 2008, we had
no interest rate swap agreements. At December 31, 2007, interest rate swap agreements designated as fair
value hedges effectively changed $300 million of fixed rate debt at an average rate of 6.01 percent to LIBOR
based floating rate debt.
Fair Value of Financial Instruments—The carrying value of cash and cash equivalents, trade accounts and
notes receivables, payables, commercial paper and short-term borrowings contained in the Consolidated
Balance Sheet approximates fair value. The Company holds investments in marketable equity securities that are
designated as cost method investments and available for sale securities, as appropriate. Such investments are
susceptible to market volatility and as a result are in unrealized loss positions as of December 31, 2008. The
Company evaluated the near-term prospects of the investees in relation to the severity and duration of the
impairments. Despite the unrealized loss position of certain investments of approximately $100 million, the
Company concluded, as of December 31, 2008, that these investments were not other than temporarily impaired
given the short duration of the unrealized loss position, the stable liquidity positions and financial condition of the
investees, and the Company's intent and ability to hold these investments for a reasonable period of time
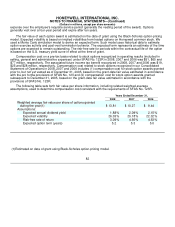
sufficient for a forecasted recovery of fair value. Summarized below are the carrying values and fair values of our
other financial instruments at December 31, 2008 and 2007. The fair values are based on the quoted market
prices for the issues (if traded), current rates offered to us for debt of the same remaining maturity and
characteristics, or other valuation techniques, as appropriate.
December 31, 2008 December 31, 2007
Carrying
Value Fair
Value Carrying
Value Fair
Value
Assets
Long-term receivables $ 517 $ 471 $ 460 $ 428
Available for sale marketable equity securities 23 23 — —
Cost method marketable equity securities 74 18 — —
Interest rate swap agreements — — 20 20
Foreign currency exchange contracts 7 7 22 22
Forward commodity contracts — — — —
Liabilities
Long-term debt and related current maturities $ (6,888) $ (7,082) $ (5,837) $ (5,928)
Foreign currency exchange contracts (34) (34) (18) (18)
Forward commodity contracts (4) (4) — —
79